Synopsis
A relationship guru and best-selling author finds himself falling for the licensed therapist who questions his methods.
Scores
Overall Score
49.1
Popularity Percentile (Year)
54.7%
Box Office Percentile (Year)
44.0%
Review Aggregate
45.2
Critic Consensus
Critic reception is mixed, with 52% of 88 logged reviews marked Fresh. Across reviews, critics repeatedly emphasize romantic, thin plot, emotional. Common reservations focus on thin plot, even when reviewers praise standout elements.
romanticthin plotemotionalcharacter-drivenfunnyrealistictragiclighthearteddarkgritty
Cast
| Cast | Year | Reported Salary | Inflation Adjusted | Notes |
|---|---|---|---|---|
| Shemar Moore | 2016 | N/A | N/A | N/A |
| Nadine Velazquez | 2016 | N/A | N/A | N/A |
| Bill Bellamy | 2016 | N/A | N/A | N/A |
| Sheryl Underwood | 2016 | N/A | N/A | N/A |
| Kali Hawk | 2016 | N/A | N/A | N/A |
Aggregated Reviews
Rotten Tomatoes critic score52.0
RT critic review count107
Rotten Tomatoes audience score32.0
RT audience rating count10,000
IMDb rating5.3
IMDb votes796
Box Office ?
| Category | Year | Reported | Inflation Adjusted |
|---|---|---|---|
| Domestic | 2016 | $321,910 | $420,763 |
| International | 2016 | $99,494 | $130,047 |
| Worldwide | 2016 | $421,404 | $550,810 |
Earnings / Profitability
| Category | Year | Reported | Inflation Adjusted |
|---|---|---|---|
| Revenues | |||
| Theatrical Net Revenue | 2016 | $200,753 | $262,400 |
| Digital Rentals ? | 2016 | $2,175,000 | $2,842,906 |
| Digital Purchases ? | 2016 | $2,217,000 | $2,897,804 |
| Physical Rentals ? | 2016 | $1,909,000 | $2,495,222 |
| Physical Purchases ? | 2016 | $5,389,000 | $7,043,872 |
| TV & Streaming Revenue | 2016 | $144,860 | $189,343 |
| Total Revenues | 2016 | $12,035,612 | $15,731,548 |
| Expenses | |||
| Budget ? | 2016 | $3,000,000 | $3,921,250 |
| Print & Advertising (P&A) ? | 2016 | $337,000 (est) | $440,487 (est) |
| Participations | 2016 | $481,000 | $628,707 |
| Residuals ? | 2016 | $674,000 | $880,974 |
| Interest & Overhead | 2016 | $600,000 | $784,250 |
| Total Expenses | 2016 | $5,092,000 | $6,655,668 |
| Movie Net Profit or Loss | 2016 | $6,943,612 | $9,075,880 |
Similar Movies
| Poster | Movie | Year | Match | Overall | Est. Profit |
|---|---|---|---|---|---|
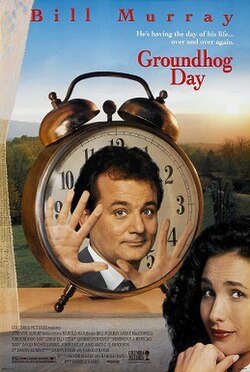 | Groundhog Day | 1993 | Shared genres: 3 | 95.4 | $78,676,439 |
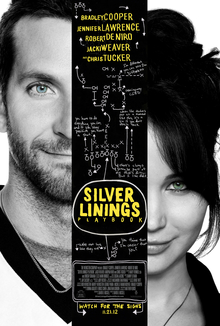 | Silver Linings Playbook | 2012 | Shared genres: 3 | 94.9 | $98,374,305 |
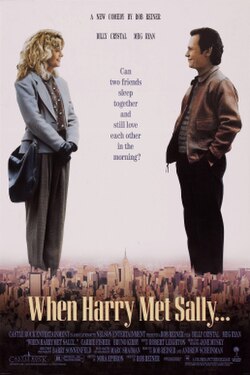 | When Harry Met Sally... | 1989 | Shared genres: 3 | 94.1 | $84,958,366 |
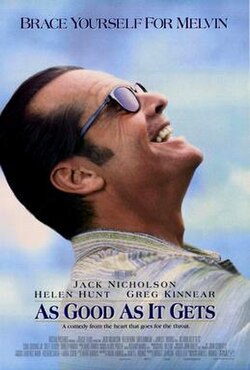 | As Good as It Gets | 1997 | Shared genres: 3 | 94.0 | $89,663,849 |
 | Coming to America | 1988 | Shared genres: 3 | 94.0 | $85,243,795 |