Synopsis
A trio of guys try and make up for missed opportunities in childhood by forming a three-player baseball team to compete against standard children's Little League squads.
Scores
Overall Score
76.9
Popularity Percentile (Year)
86.0%
Box Office Percentile (Year)
85.3%
Review Aggregate
41.6
Critic Consensus
Critic reception is mixed, with 14% of 66 logged reviews marked Fresh. Across reviews, critics repeatedly emphasize thin plot, funny, lighthearted. Common reservations focus on thin plot, even when reviewers praise standout elements.
thin plotfunnylightheartedfamily-friendlypsychologicalcharacter-driven
Cast
| Cast | Year | Reported Salary | Inflation Adjusted | Notes |
|---|---|---|---|---|
| Rob Schneider | 2006 | $1,986,000 | $3,090,000 | (est) |
| David Spade | 2006 | $1,222,000 | $1,902,000 | (est) |
| Jon Heder | 2006 | $920,000 | $1,432,000 | (est) |
| Jon Lovitz | 2006 | $752,000 | $1,171,000 | (est) |
| Craig Kilborn | 2006 | $644,000 | $1,002,000 | (est) |
| Molly Sims | 2006 | $567,000 | $882,000 | (est) |
| Tim Meadows | 2006 | $509,000 | $791,000 | (est) |
Aggregated Reviews
Rotten Tomatoes critic score13.0
RT critic review count69
Rotten Tomatoes audience score64.0
RT audience rating count250,000
IMDb rating5.6
IMDb votes57,317
Box Office ?
| Category | Year | Reported | Inflation Adjusted |
|---|---|---|---|
| Domestic | 2006 | $59,843,752 | $93,119,965 |
| International | 2006 | $5,118,875 | $7,965,234 |
| Worldwide | 2006 | $64,962,628 | $101,085,200 |
Earnings / Profitability
| Category | Year | Reported | Inflation Adjusted |
|---|---|---|---|
| Revenues | |||
| Theatrical Net Revenue | 2006 | $31,969,426 | $49,746,076 |
| Digital Rentals ? | 2006 | $523,000 | $813,815 |
| Digital Purchases ? | 2006 | $161,000 | $250,524 |
| Physical Rentals ? | 2006 | $16,531,000 | $25,723,089 |
| Physical Purchases ? | 2006 | $38,993,000 | $60,675,119 |
| TV & Streaming Revenue | 2006 | $14,960,938 | $23,279,991 |
| Total Revenues | 2006 | $103,138,364 | $160,488,614 |
| Expenses | |||
| Budget ? | 2006 | $33,000,000 | $51,349,702 |
| Print & Advertising (P&A) ? | 2006 | $13,865,000 (est) | $21,574,655 (est) |
| Participations | 2006 | $8,251,000 | $12,838,982 |
| Residuals ? | 2006 | $4,845,000 | $7,539,070 |
| Interest & Overhead | 2006 | $5,610,000 | $8,729,449 |
| Total Expenses | 2006 | $65,571,000 | $102,031,858 |
| Movie Net Profit or Loss | 2006 | $37,567,364 | $58,456,756 |
Similar Movies
| Poster | Movie | Year | Match | Overall | Est. Profit |
|---|---|---|---|---|---|
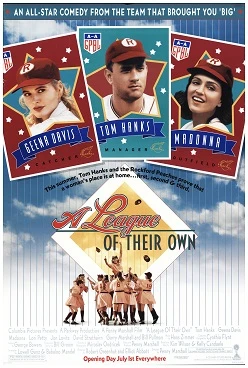 | A League of Their Own | 1992 | Shared genres: 5 | 92.3 | $88,255,465 |
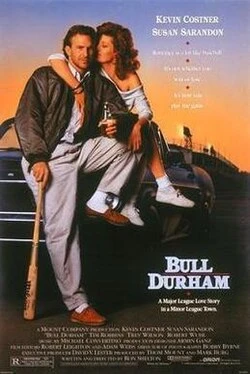 | Bull Durham | 1988 | Shared genres: 5 | 89.2 | $55,979,546 |
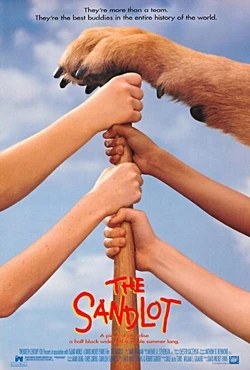 | The Sandlot | 1993 | Shared genres: 5 | 85.6 | $63,958,704 |
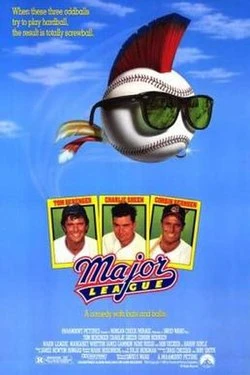 | Major League | 1989 | Shared genres: 5 | 84.9 | $67,508,861 |
 | Angels in the Outfield | 1994 | Shared genres: 5 | 80.9 | $72,021,624 |