Synopsis
Tanu and Manu's marriage collapses. What happens when Manu meets Tanu's lookalike Kusum - and when Tanu returns?
Scores
Overall Score
66.7
Popularity Percentile (Year)
69.4%
Box Office Percentile (Year)
61.8%
Review Aggregate
69.5
Critic Consensus
Critic reception is mixed, with 64% of 11 logged reviews marked Fresh. Across reviews, critics repeatedly emphasize gritty, funny, character-driven. Common reservations focus on execution consistency, even when reviewers praise standout elements.
grittyfunnycharacter-drivenromanticemotionalvisually striking
Cast
| Cast | Year | Reported Salary | Inflation Adjusted | Notes |
|---|---|---|---|---|
| R. Madhavan | 2015 | $0 | $0 | (est) |
| Kangana Ranaut | 2015 | $0 | $0 | (est) |
| Jimmy Sheirgill | 2015 | $0 | $0 | (est) |
| Swara Bhaskar | 2015 | $0 | $0 | (est) |
| Deepak Dobriyal | 2015 | $0 | $0 | (est) |
Aggregated Reviews
Rotten Tomatoes critic score64.0
RT critic review count11
Rotten Tomatoes audience score71.0
RT audience rating count500
IMDb rating7.6
IMDb votes30,388
Box Office ?
| Category | Year | Reported | Inflation Adjusted |
|---|---|---|---|
| Domestic | 2015 | $3,043,479 | $4,028,436 |
| International | 2015 | $1,136,602 | $1,504,439 |
| Worldwide | 2015 | $4,180,081 | $5,532,875 |
Earnings / Profitability
| Category | Year | Reported | Inflation Adjusted |
|---|---|---|---|
| Revenues | |||
| Theatrical Net Revenue | 2015 | $1,976,380 | $2,615,994 |
| Digital Rentals ? | 2015 | $3,041,000 | $4,025,155 |
| Digital Purchases ? | 2015 | $3,189,000 | $4,221,052 |
| Physical Rentals ? | 2015 | $3,450,000 | $4,566,519 |
| Physical Purchases ? | 2015 | $9,245,000 | $12,236,947 |
| TV & Streaming Revenue | 2015 | $1,217,392 | $1,611,374 |
| Total Revenues | 2015 | $22,118,772 | $29,277,041 |
| Expenses | |||
| Budget ? | 2015 | $40 | $53 |
| Print & Advertising (P&A) ? source | 2015 | $1,560,000 | $2,064,861 |
| Participations | 2015 | $885,000 | $1,171,411 |
| Residuals ? | 2015 | $1,181,000 | $1,563,205 |
| Interest & Overhead | 2015 | $8 | $11 |
| Total Expenses | 2015 | $3,626,048 | $4,799,541 |
| Movie Net Profit or Loss | 2015 | $18,492,724 | $24,477,500 |
Similar Movies
| Poster | Movie | Year | Match | Overall | Est. Profit |
|---|---|---|---|---|---|
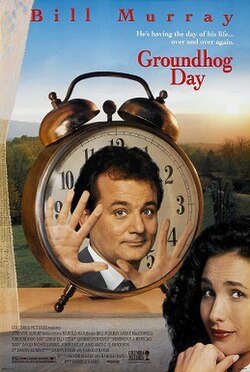 | Groundhog Day | 1993 | Shared genres: 4 | 95.4 | $78,676,439 |
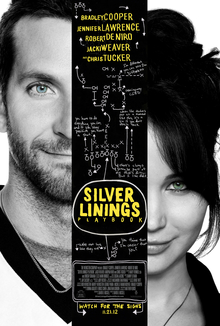 | Silver Linings Playbook | 2012 | Shared genres: 4 | 94.9 | $98,374,305 |
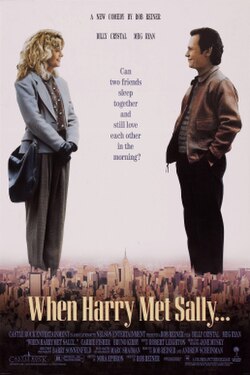 | When Harry Met Sally... | 1989 | Shared genres: 4 | 94.1 | $84,958,366 |
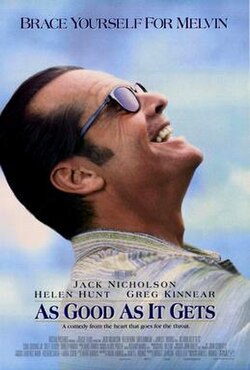 | As Good as It Gets | 1997 | Shared genres: 4 | 94.0 | $89,663,849 |
 | Notting Hill | 1999 | Shared genres: 4 | 93.8 | $129,254,949 |