Synopsis
Romeo and Juliet secretly wed despite the sworn contempt their families hold for each other. It is not long, however, before a chain of fateful events changes the lives of both families forever.
Scores
Overall Score
55.3
Popularity Percentile (Year)
54.7%
Box Office Percentile (Year)
64.5%
Review Aggregate
40.6
Critic Consensus
Critic reception is largely negative, with 26% of 89 logged reviews marked Fresh. Across reviews, critics repeatedly emphasize romantic, thin plot, tragic. Many reviews cite thin plot, uneven tone as the main reasons it falls short.
romanticthin plottragicfamily-friendlycoming of agefunnyvisually strikinguneven tonerealisticdark
Cast
| Cast | Year | Reported Salary | Inflation Adjusted | Notes |
|---|---|---|---|---|
| Hailee Steinfeld | 2013 | $34,000 | $46,000 | (est) |
| Douglas Booth | 2013 | $21,000 | $28,000 | (est) |
| Damian Lewis | 2013 | $16,000 | $21,000 | (est) |
| Kodi Smit-McPhee | 2013 | $13,000 | $17,000 | (est) |
| Ed Westwick | 2013 | $11,000 | $15,000 | (est) |
| Paul Giamatti | 2013 | $10,000 | $13,000 | (est) |
Aggregated Reviews
Rotten Tomatoes critic score25.0
RT critic review count89
Rotten Tomatoes audience score46.0
RT audience rating count1,000
IMDb rating5.8
IMDb votes13,102
Box Office ?
| Category | Year | Reported | Inflation Adjusted |
|---|---|---|---|
| Domestic | 2013 | $1,162,635 | $1,565,316 |
| International | 2013 | $1,803,633 | $2,428,325 |
| Worldwide | 2013 | $2,966,268 | $3,993,641 |
Earnings / Profitability
| Category | Year | Reported | Inflation Adjusted |
|---|---|---|---|
| Revenues | |||
| Theatrical Net Revenue | 2013 | $1,302,771 | $1,753,988 |
| Digital Rentals ? | 2013 | $3,047,000 | $4,102,334 |
| Digital Purchases ? | 2013 | $1,821,000 | $2,451,707 |
| Physical Rentals ? | 2013 | $3,938,000 | $5,301,934 |
| Physical Purchases ? | 2013 | $10,204,000 | $13,738,175 |
| TV & Streaming Revenue | 2013 | $465,054 | $626,126 |
| Total Revenues | 2013 | $20,777,825 | $27,974,264 |
| Expenses | |||
| Budget ? | 2013 | $3,263,000 (est) | $4,393,146 (est) |
| Print & Advertising (P&A) ? | 2013 | $2,493,000 (est) | $3,356,455 (est) |
| Participations | 2013 | $831,000 | $1,118,818 |
| Residuals ? | 2013 | $1,232,000 | $1,658,706 |
| Interest & Overhead | 2013 | $652,600 | $878,629 |
| Total Expenses | 2013 | $8,471,600 | $11,405,755 |
| Movie Net Profit or Loss | 2013 | $12,306,225 | $16,568,509 |
Similar Movies
| Poster | Movie | Year | Match | Overall | Est. Profit |
|---|---|---|---|---|---|
 | The Fault in Our Stars | 2014 | Shared genres: 3 | 93.3 | $137,521,227 |
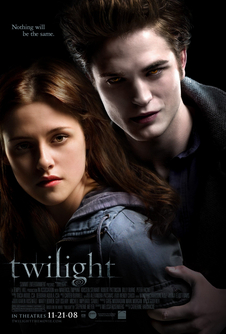 | Twilight | 2008 | Shared genres: 3 | 90.2 | $157,209,631 |
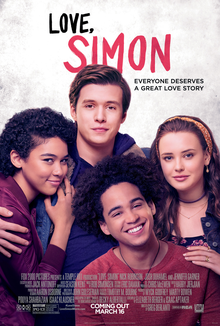 | Love, Simon | 2018 | Shared genres: 3 | 90.0 | $13,733,735 |
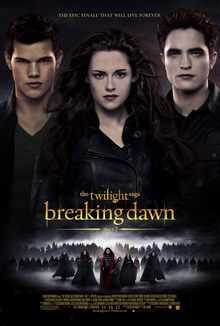 | The Twilight Saga: Breaking Dawn - Part 2 | 2012 | Shared genres: 3 | 89.5 | $201,719,128 |
 | The Twilight Saga: Eclipse | 2010 | Shared genres: 3 | 88.1 | $233,606,827 |