Synopsis
Shakespeare's famous play is updated to the hip modern suburb of Verona still retaining its original dialogue.
Scores
Overall Score
84.9
Popularity Percentile (Year)
90.6%
Box Office Percentile (Year)
87.7%
Review Aggregate
67.0
Critic Consensus
No professional critic quote data was available to synthesize a consensus summary.
No tags
Cast
| Cast | Year | Reported Salary | Inflation Adjusted | Notes |
|---|---|---|---|---|
| Leonardo DiCaprio | 1996 | $873,000 | $1,745,000 | (est) |
| Claire Danes | 1996 | $537,000 | $1,074,000 | (est) |
| Brian Dennehy | 1996 | $404,000 | $809,000 | (est) |
| John Leguizamo | 1996 | $331,000 | $661,000 | (est) |
| Pete Postlethwaite | 1996 | $283,000 | $565,000 | (est) |
| Paul Sorvino | 1996 | $249,000 | $498,000 | (est) |
| Diane Venora | 1996 | $223,000 | $447,000 | (est) |
Aggregated Reviews
Rotten Tomatoes critic scoreN/A
RT critic review countN/A
Rotten Tomatoes audience scoreN/A
RT audience rating countN/A
IMDb rating6.7
IMDb votes254,332
Box Office ?
| Category | Year | Reported | Inflation Adjusted |
|---|---|---|---|
| Domestic | 1996 | $46,351,345 | $92,673,148 |
| International | 1996 | N/A | N/A |
| Worldwide | 1996 | $46,353,582 | $92,677,621 |
Earnings / Profitability
| Category | Year | Reported | Inflation Adjusted |
|---|---|---|---|
| Revenues | |||
| Theatrical Net Revenue | 1996 | $23,175,672 | $46,336,574 |
| Digital Rentals ? | 1996 | N/A | N/A |
| Digital Purchases ? | 1996 | N/A | N/A |
| Physical Rentals ? | 1996 | $37,326,000 | $74,628,210 |
| Physical Purchases ? | 1996 | $44,221,000 | $88,413,816 |
| TV & Streaming Revenue | 1996 | $11,587,836 | $23,168,287 |
| Total Revenues | 1996 | $116,310,509 | $232,546,887 |
| Expenses | |||
| Budget ? | 1996 | $14,500,000 | $28,990,758 |
| Print & Advertising (P&A) ? | 1996 | $11,407,000 (est) | $22,806,730 (est) |
| Participations | 1996 | $9,305,000 | $18,604,069 |
| Residuals ? | 1996 | $6,582,000 | $13,159,805 |
| Interest & Overhead | 1996 | $2,900,000 | $5,798,152 |
| Total Expenses | 1996 | $44,694,000 | $89,359,514 |
| Movie Net Profit or Loss | 1996 | $71,616,509 | $143,187,373 |
Similar Movies
| Poster | Movie | Year | Match | Overall | Est. Profit |
|---|---|---|---|---|---|
 | The Fault in Our Stars | 2014 | Shared genres: 3 | 93.3 | $137,521,227 |
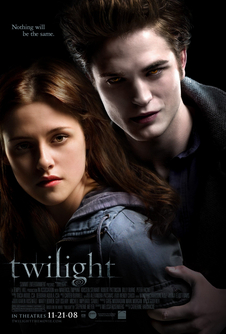 | Twilight | 2008 | Shared genres: 3 | 90.2 | $157,209,631 |
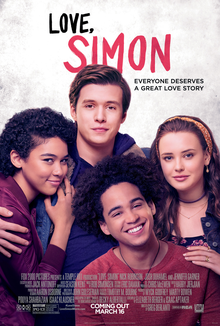 | Love, Simon | 2018 | Shared genres: 3 | 90.0 | $13,733,735 |
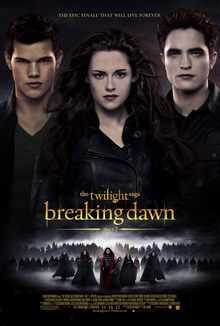 | The Twilight Saga: Breaking Dawn - Part 2 | 2012 | Shared genres: 3 | 89.5 | $201,719,128 |
 | The Twilight Saga: Eclipse | 2010 | Shared genres: 3 | 88.1 | $233,606,827 |