Synopsis
A group of teens discovers secret plans for a time machine, and construct one. However, things start to get out of control.
Scores
Overall Score
75.8
Popularity Percentile (Year)
86.1%
Box Office Percentile (Year)
79.0%
Review Aggregate
47.0
Critic Consensus
Critic reception is mixed, with 38% of 98 logged reviews marked Fresh. Across reviews, critics repeatedly emphasize coming of age, gritty, romantic. Common reservations focus on execution consistency, even when reviewers praise standout elements.
coming of agegrittyromanticvisually strikingpsychologicalrealisticlightheartedmacabrestylized
Cast
| Cast | Year | Reported Salary | Inflation Adjusted | Notes |
|---|---|---|---|---|
| Jonny Weston | 2015 | $782,000 | $1,036,000 | (est) |
| Sofia Black-D'Elia | 2015 | $482,000 | $638,000 | (est) |
| Sam Lerner | 2015 | $363,000 | $480,000 | (est) |
| Allen Evangelista | 2015 | $296,000 | $392,000 | (est) |
| Virginia Gardner | 2015 | $254,000 | $336,000 | (est) |
| Amy Landecker | 2015 | $223,000 | $295,000 | (est) |
Aggregated Reviews
Rotten Tomatoes critic score38.0
RT critic review count98
Rotten Tomatoes audience score45.0
RT audience rating count25,000
IMDb rating6.4
IMDb votes86,767
Box Office ?
| Category | Year | Reported | Inflation Adjusted |
|---|---|---|---|
| Domestic | 2015 | $22,348,240 | $29,580,773 |
| International | 2015 | $10,865,000 | $14,381,227 |
| Worldwide | 2015 | $33,213,240 | $43,962,000 |
Earnings / Profitability
| Category | Year | Reported | Inflation Adjusted |
|---|---|---|---|
| Revenues | |||
| Theatrical Net Revenue | 2015 | $15,520,120 | $20,542,877 |
| Digital Rentals ? | 2015 | $3,774,000 | $4,995,375 |
| Digital Purchases ? | 2015 | $3,957,000 | $5,237,599 |
| Physical Rentals ? | 2015 | $4,281,000 | $5,666,455 |
| Physical Purchases ? | 2015 | $11,472,000 | $15,184,669 |
| TV & Streaming Revenue | 2015 | $5,363,578 | $7,099,386 |
| Total Revenues | 2015 | $44,367,698 | $58,726,361 |
| Expenses | |||
| Budget ? | 2015 | $12,000,000 | $15,883,545 |
| Print & Advertising (P&A) ? | 2015 | $15,000,000 (est) | $19,854,432 (est) |
| Participations | 2015 | $1,775,000 | $2,349,441 |
| Residuals ? | 2015 | $1,652,000 | $2,186,635 |
| Interest & Overhead | 2015 | $2,400,000 | $3,176,709 |
| Total Expenses | 2015 | $32,827,000 | $43,450,762 |
| Movie Net Profit or Loss | 2015 | $11,540,698 | $15,275,599 |
Similar Movies
| Poster | Movie | Year | Match | Overall | Est. Profit |
|---|---|---|---|---|---|
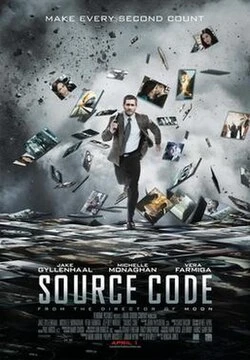 | Source Code | 2011 | Shared genres: 5 | 92.8 | $32,820,359 |
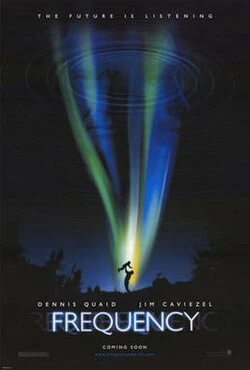 | Frequency | 2000 | Shared genres: 5 | 82.1 | $37,103,097 |
 | Europa Report | 2013 | Shared genres: 5 | 61.5 | $1,114,687 |
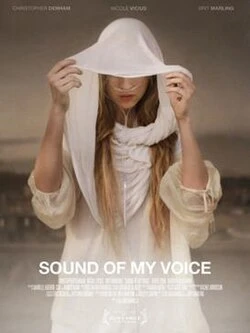 | Sound of My Voice | 2012 | Shared genres: 5 | 58.3 | $16,548,803 |
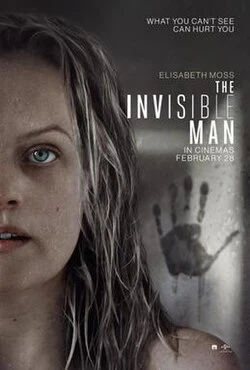 | The Invisible Man | 2020 | Shared genres: 4 | 95.0 | $95,007,588 |