Synopsis
When his uptight CEO sister threatens to shut down his branch, the branch manager throws an epic Christmas party in order to land a big client and save the day, but the party gets way out of hand...
Scores
Overall Score
78.6
Popularity Percentile (Year)
84.3%
Box Office Percentile (Year)
90.1%
Review Aggregate
45.5
Critic Consensus
Critic reception is mixed, with 41% of 185 logged reviews marked Fresh. Across reviews, critics repeatedly emphasize christmas, funny, lighthearted. Common reservations focus on execution consistency, even when reviewers praise standout elements.
christmasfunnylightheartedstylizedcharacter-drivenmacabreemotionalvisually strikingthought-provokingpolitical
Cast
| Cast | Year | Reported Salary | Inflation Adjusted | Notes |
|---|---|---|---|---|
| Jason Bateman | 2016 | $2,720,000 | $3,555,000 | (est) |
| Olivia Munn | 2016 | $1,674,000 | $2,188,000 | (est) |
| T.J. Miller | 2016 | $1,260,000 | $1,648,000 | (est) |
| Jillian Bell | 2016 | $1,031,000 | $1,347,000 | (est) |
| Courtney B. Vance | 2016 | $882,000 | $1,152,000 | (est) |
| Rob Corddry | 2016 | $776,000 | $1,014,000 | (est) |
| Sam Richardson | 2016 | $697,000 | $910,000 | (est) |
| Randall Park | 2016 | $634,000 | $829,000 | (est) |
| Kate McKinnon | 2016 | $584,000 | $764,000 | (est) |
| Jennifer Aniston | 2016 | $543,000 | $709,000 | (est) |
Aggregated Reviews
Rotten Tomatoes critic score41.0
RT critic review count185
Rotten Tomatoes audience score41.0
RT audience rating count10,000
IMDb rating5.9
IMDb votes92,072
Box Office ?
| Category | Year | Reported | Inflation Adjusted |
|---|---|---|---|
| Domestic | 2016 | $54,767,496 | $71,585,683 |
| International | 2016 | $59,733,804 | $78,077,062 |
| Worldwide | 2016 | $114,501,296 | $149,662,740 |
Earnings / Profitability
| Category | Year | Reported | Inflation Adjusted |
|---|---|---|---|
| Revenues | |||
| Theatrical Net Revenue | 2016 | $51,277,270 | $67,023,666 |
| Digital Rentals ? | 2016 | $4,327,000 | $5,655,750 |
| Digital Purchases ? | 2016 | $4,411,000 | $5,765,545 |
| Physical Rentals ? | 2016 | $3,798,000 | $4,964,303 |
| Physical Purchases ? | 2016 | $10,719,000 | $14,010,627 |
| TV & Streaming Revenue | 2016 | $13,691,874 | $17,896,421 |
| Total Revenues | 2016 | $88,224,144 | $115,316,311 |
| Expenses | |||
| Budget ? | 2016 | $45,000,000 | $58,818,752 |
| Print & Advertising (P&A) ? | 2016 | $29,826,000 (est) | $38,985,069 (est) |
| Participations | 2016 | $3,529,000 | $4,612,697 |
| Residuals ? | 2016 | $1,994,000 | $2,606,324 |
| Interest & Overhead | 2016 | $7,650,000 | $9,999,188 |
| Total Expenses | 2016 | $87,999,000 | $115,022,030 |
| Movie Net Profit or Loss | 2016 | $225,144 | $294,281 |
Similar Movies
| Poster | Movie | Year | Match | Overall | Est. Profit |
|---|---|---|---|---|---|
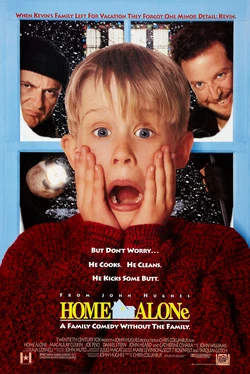 | Home Alone | 1990 | Shared genres: 2 | 94.3 | $232,387,197 |
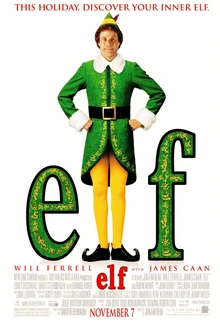 | Elf | 2003 | Shared genres: 2 | 92.8 | $104,188,811 |
 | National Lampoon's Christmas Vacation | 1989 | Shared genres: 2 | 90.6 | $69,578,363 |
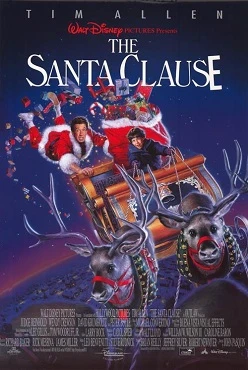 | The Santa Clause | 1994 | Shared genres: 2 | 90.5 | $137,930,087 |
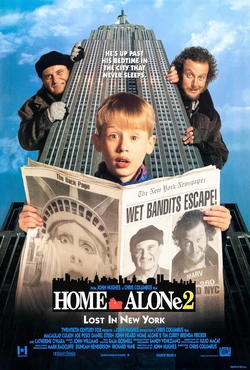 | Home Alone 2: Lost in New York | 1992 | Shared genres: 2 | 89.6 | $142,138,740 |