Synopsis
A musical set mainly in a corporate high-rise. Two assistants, Lee Xiang and Kat, start new jobs at the financial firm Jones & Sunn. Lee Xiang is an earnest young man who naively enters the world of high finance with noble intentions. Kat on the other hand has a secret.
Scores
Overall Score
45.6
Popularity Percentile (Year)
18.1%
Box Office Percentile (Year)
68.5%
Review Aggregate
67.6
Critic Consensus
Critic reception is largely positive, with 87% of 31 logged reviews marked Fresh. Across reviews, critics repeatedly emphasize visually striking, stylized, realistic. Most critics frame the film as an effective delivery of its core style and intent.
visually strikingstylizedrealisticsatiricalemotionalfunnyromantic
Cast
| Cast | Year | Reported Salary | Inflation Adjusted | Notes |
|---|---|---|---|---|
| N/A | ||||
Aggregated Reviews
Rotten Tomatoes critic score87.0
RT critic review count31
Rotten Tomatoes audience score50.0
RT audience rating count100
IMDb rating6.1
IMDb votes1,063
Box Office ?
| Category | Year | Reported | Inflation Adjusted |
|---|---|---|---|
| Domestic | 2015 | $63,675 | $84,282 |
| International | 2015 | $8,226,846 | $10,889,289 |
| Worldwide | 2015 | $8,290,521 | $10,973,571 |
Earnings / Profitability
| Category | Year | Reported | Inflation Adjusted |
|---|---|---|---|
| Revenues | |||
| Theatrical Net Revenue | 2015 | $3,322,576 | $4,397,857 |
| Digital Rentals ? | 2015 | $1,103,000 | $1,459,962 |
| Digital Purchases ? | 2015 | $1,157,000 | $1,531,438 |
| Physical Rentals ? | 2015 | $1,251,000 | $1,655,859 |
| Physical Purchases ? | 2015 | $3,353,000 | $4,438,127 |
| TV & Streaming Revenue | 2015 | $3,979,500 | $5,267,380 |
| Total Revenues | 2015 | $14,166,076 | $18,750,625 |
| Expenses | |||
| Budget ? | 2015 | $13,265,000 (est) | $17,557,935 (est) |
| Print & Advertising (P&A) ? | 2015 | $2,156,000 (est) | $2,853,743 (est) |
| Participations | 2015 | $283,000 | $374,587 |
| Residuals ? | 2015 | $592,000 | $783,588 |
| Interest & Overhead | 2015 | $2,653,000 | $3,511,587 |
| Total Expenses | 2015 | $18,949,000 | $25,081,440 |
| Movie Net Profit or Loss | 2015 | $-4,782,924 | $-6,330,816 |
Similar Movies
| Poster | Movie | Year | Match | Overall | Est. Profit |
|---|---|---|---|---|---|
 | Aladdin | 1992 | Shared genres: 3 | 97.7 | $232,328,117 |
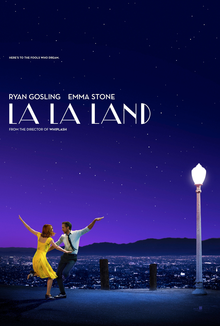 | La La Land | 2016 | Shared genres: 3 | 95.8 | $147,267,763 |
 | Tangled | 2010 | Shared genres: 3 | 95.4 | $-31,230,690 |
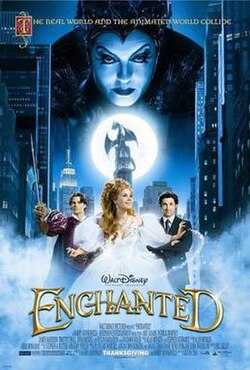 | Enchanted | 2007 | Shared genres: 3 | 93.4 | $60,033,820 |
 | Aladdin | 2019 | Shared genres: 3 | 93.2 | $151,389,228 |