Screen Profits
Most Profitable Movies
Most Profitable Movies
Movies Decade
Genres
Franchises
Actor Net Worth Rankings
Back to movie
My Kingdom (2011) Similar Movies
20 similar titles
Similar Movies
House of Flying Daggers
Year
2004
Overall
85.5
Est. Profit
$49,969,610
Crouching Tiger, Hidden Dragon
Year
2000
Overall
81.1
Est. Profit
$127,357,266
Sultan
Year
2016
Overall
80.4
Est. Profit
$32,078,000
Elle
Year
2016
Overall
77.9
Est. Profit
$4,224,479
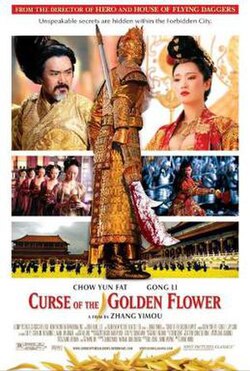
Curse of the Golden Flower
Year
2006
Overall
76.2
Est. Profit
$2,731,294
The Grandmaster
Year
2013
Overall
75.4
Est. Profit
$-237,535,826
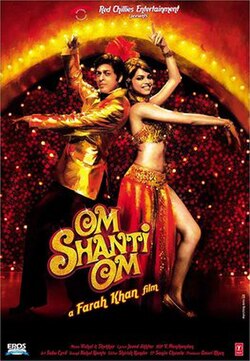
Om Shanti Om
Year
2007
Overall
74.3
Est. Profit
$45,338,962
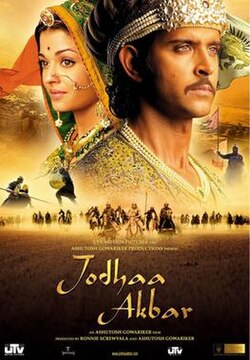
Jodhaa Akbar
Year
2008
Overall
70.6
Est. Profit
$37,194,453
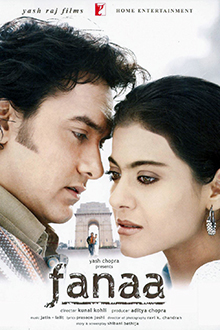
Fanaa
Year
2006
Overall
70.4
Est. Profit
$37,498,003
Main Hoon Na
Year
2004
Overall
68.9
Est. Profit
$25,929,238
Koi... Mil Gaya
Year
2003
Overall
67.7
Est. Profit
$30,341,949
The Warlords
Year
2010
Overall
66.6
Est. Profit
$-19,640,281
Lakshya
Year
2004
Overall
66.0
Est. Profit
$23,456,497
Ek Tha Tiger
Year
2012
Overall
65.9
Est. Profit
$21,901,044
Housefull 4
Year
2019
Overall
64.4
Est. Profit
$15,226,069
Flame & Citron
Year
2009
Overall
62.4
Est. Profit
$6,429,287
Singh Is King
Year
2008
Overall
61.3
Est. Profit
$34,204,523
I
Year
2015
Overall
61.2
Est. Profit
$17,322,541
Housefull 2
Year
2012
Overall
60.8
Est. Profit
$14,988,952
The Villain
Year
2014
Overall
59.6
Est. Profit
$16,106,072
 House of Flying Daggers