Synopsis
Based on the incredible true story of the Beam family.
Scores
Overall Score
76.6
Popularity Percentile (Year)
74.5%
Box Office Percentile (Year)
86.7%
Review Aggregate
63.8
Critic Consensus
Critic reception is mixed, with 45% of 91 logged reviews marked Fresh. Across reviews, critics repeatedly emphasize emotional, uplifting, family-friendly. Common reservations focus on execution consistency, even when reviewers praise standout elements.
emotionalupliftingfamily-friendlycharacter-drivenlightheartedgrittyhistoricalcoming of age
Cast
| Cast | Year | Reported Salary | Inflation Adjusted | Notes |
|---|---|---|---|---|
| Jennifer Garner | 2016 | $848,000 | $1,108,000 | (est) |
| Kylie Rogers | 2016 | $522,000 | $682,000 | (est) |
| Martin Henderson | 2016 | $393,000 | $513,000 | (est) |
| John Carroll Lynch | 2016 | $321,000 | $420,000 | (est) |
| Eugenio Derbez | 2016 | $275,000 | $359,000 | (est) |
| Queen Latifah | 2016 | $242,000 | $316,000 | (est) |
Aggregated Reviews
Rotten Tomatoes critic score45.0
RT critic review count91
Rotten Tomatoes audience score80.0
RT audience rating count10,000
IMDb rating7.1
IMDb votes30,817
Box Office ?
| Category | Year | Reported | Inflation Adjusted |
|---|---|---|---|
| Domestic | 2016 | $61,705,123 | $80,653,738 |
| International | 2016 | $12,277,880 | $16,048,212 |
| Worldwide | 2016 | $73,983,003 | $96,701,950 |
Earnings / Profitability
| Category | Year | Reported | Inflation Adjusted |
|---|---|---|---|
| Revenues | |||
| Theatrical Net Revenue | 2016 | $35,763,714 | $46,746,154 |
| Digital Rentals ? | 2016 | $4,259,000 | $5,566,868 |
| Digital Purchases ? | 2016 | $4,341,000 | $5,674,049 |
| Physical Rentals ? | 2016 | $3,739,000 | $4,887,185 |
| Physical Purchases ? | 2016 | $10,551,000 | $13,791,036 |
| TV & Streaming Revenue | 2016 | $15,426,281 | $20,163,434 |
| Total Revenues | 2016 | $74,079,994 | $96,828,726 |
| Expenses | |||
| Budget ? | 2016 | $13,000,000 | $16,992,083 |
| Print & Advertising (P&A) ? | 2016 | $16,250,000 (est) | $21,240,104 (est) |
| Participations | 2016 | $5,926,000 | $7,745,776 |
| Residuals ? | 2016 | $2,056,000 | $2,687,363 |
| Interest & Overhead | 2016 | $2,600,000 | $3,398,417 |
| Total Expenses | 2016 | $39,832,000 | $52,063,743 |
| Movie Net Profit or Loss | 2016 | $34,247,994 | $44,764,982 |
Similar Movies
| Poster | Movie | Year | Match | Overall | Est. Profit |
|---|---|---|---|---|---|
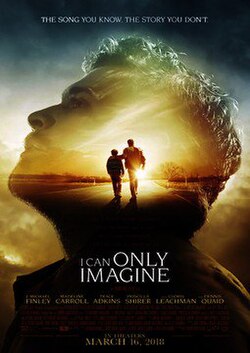 | I Can Only Imagine | 2018 | Shared genres: 5 | 79.9 | $56,176,576 |
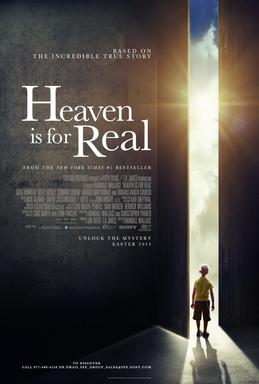 | Heaven Is for Real | 2014 | Shared genres: 5 | 78.8 | $60,411,346 |
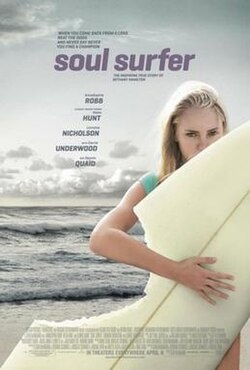 | Soul Surfer | 2011 | Shared genres: 5 | 73.3 | $14,678,078 |
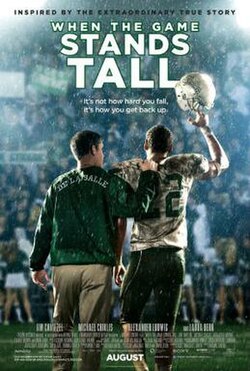 | When the Game Stands Tall | 2014 | Shared genres: 5 | 67.4 | $9,333,009 |
 | Thérèse: The Story of Saint Thérèse of Lisieux | 2004 | Shared genres: 5 | 35.8 | $22,779,639 |