Synopsis
Three couples who know one another are stuck at home during the beginning of lockdown. Jonathan, Clarissa and Paul will see their lives turned upside-down, forced to look at each other and ultimately at themselves.
Scores
Overall Score
17.0
Popularity Percentile (Year)
20.2%
Box Office Percentile (Year)
3.7%
Review Aggregate
33.0
Critic Consensus
Critic reception is largely negative, with 6% of 18 logged reviews marked Fresh. Across reviews, critics repeatedly emphasize thin plot, romantic, emotional. Many reviews cite thin plot as the main reasons it falls short.
thin plotromanticemotionalfunnypsychologicalsatirical
Cast
| Cast | Year | Reported Salary | Inflation Adjusted | Notes |
|---|---|---|---|---|
| Bob Odenkirk | 2023 | $0 | $0 | (est) |
| Danny Huston | 2023 | $0 | $0 | (est) |
| Radha Mitchell | 2023 | $0 | $0 | (est) |
| Rosie Fellner | 2023 | $0 | $0 | (est) |
Aggregated Reviews
Rotten Tomatoes critic score6.0
RT critic review count18
Rotten Tomatoes audience score54.0
RT audience rating count25
IMDb rating4.7
IMDb votes611
Box Office ?
| Category | Year | Reported | Inflation Adjusted |
|---|---|---|---|
| Domestic | 2023 | $4,467 | $4,599 |
| International | 2023 | $2,550 | $2,625 |
| Worldwide | 2023 | $7,017 | $7,224 |
Earnings / Profitability
| Category | Year | Reported | Inflation Adjusted |
|---|---|---|---|
| Revenues | |||
| Theatrical Net Revenue | 2023 | $3,254 | $3,350 |
| Digital Rentals ? | 2023 | $42,000 | $43,241 |
| Digital Purchases ? | 2023 | $65,000 | $66,920 |
| Physical Rentals ? | 2023 | $9,000 | $9,266 |
| Physical Purchases ? | 2023 | $28,000 | $28,827 |
| TV & Streaming Revenue | 2023 | $75,000 | $77,215 |
| Total Revenues | 2023 | $222,254 | $228,818 |
| Expenses | |||
| Budget ? | 2023 | $250,000 (est) | $257,384 (est) |
| Print & Advertising (P&A) ? | 2023 | $80,000 (est) | $82,363 (est) |
| Participations | 2023 | $4,000 | $4,118 |
| Residuals ? | 2023 | $9,000 | $9,266 |
| Interest & Overhead | 2023 | $50,000 | $51,477 |
| Total Expenses | 2023 | $393,000 | $404,608 |
| Movie Net Profit or Loss | 2023 | $-170,746 | $-175,790 |
Similar Movies
| Poster | Movie | Year | Match | Overall | Est. Profit |
|---|---|---|---|---|---|
 | Aladdin | 1992 | Shared genres: 2 | 97.7 | $232,328,117 |
 | Shrek | 2001 | Shared genres: 2 | 95.9 | $196,186,888 |
 | Big | 1988 | Shared genres: 2 | 95.9 | $84,885,693 |
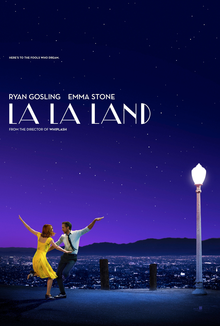 | La La Land | 2016 | Shared genres: 2 | 95.8 | $147,267,763 |
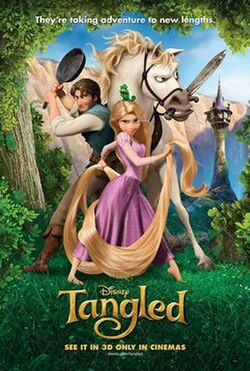 | Tangled | 2010 | Shared genres: 2 | 95.4 | $-31,230,690 |