Synopsis
When Jon returns on his first trip home from college, he inadvertently triggers events that inspire him to embark on an auspicious journey through the night to return a lost locket.
Scores
Overall Score
40.1
Popularity Percentile (Year)
50.3%
Box Office Percentile (Year)
3.4%
Review Aggregate
81.3
Critic Consensus
Critic reception is largely positive, with 92% of 260 logged reviews marked Fresh. Across reviews, critics repeatedly emphasize emotional, suspenseful, stylized. Most critics frame the film as an effective delivery of its core style and intent.
emotionalsuspensefulstylizedvisually strikingpsychologicalcharacter-drivenfamily-friendlycoming of agerealisticthought-provoking
Cast
| Cast | Year | Reported Salary | Inflation Adjusted | Notes |
|---|---|---|---|---|
| John Cho | 2018 | $87,000 | $109,000 | (est) |
| Debra Messing | 2018 | $54,000 | $67,000 | (est) |
Aggregated Reviews
Rotten Tomatoes critic score92.0
RT critic review count260
Rotten Tomatoes audience score88.0
RT audience rating count5,000
IMDb rating5.5
IMDb votes35
Box Office ?
| Category | Year | Reported | Inflation Adjusted |
|---|---|---|---|
| Domestic | 2018 | $5,210 | $6,509 |
| International | 2018 | N/A | N/A |
| Worldwide | 2018 | $5,210 | $6,509 |
Earnings / Profitability
| Category | Year | Reported | Inflation Adjusted |
|---|---|---|---|
| Revenues | |||
| Theatrical Net Revenue | 2018 | $2,605 | $3,254 |
| Digital Rentals ? | 2018 | $91,000 | $113,687 |
| Digital Purchases ? | 2018 | $110,000 | $137,423 |
| Physical Rentals ? | 2018 | $56,000 | $69,961 |
| Physical Purchases ? | 2018 | $159,000 | $198,639 |
| TV & Streaming Revenue | 2018 | $264,000 | $329,816 |
| Total Revenues | 2018 | $682,605 | $852,781 |
| Expenses | |||
| Budget ? | 2018 | $880,000 | $1,099,387 |
| Print & Advertising (P&A) ? | 2018 | $80,000 (est) | $99,944 (est) |
| Participations | 2018 | $14,000 | $17,490 |
| Residuals ? | 2018 | $33,000 | $41,227 |
| Interest & Overhead | 2018 | $176,000 | $219,877 |
| Total Expenses | 2018 | $1,183,000 | $1,477,926 |
| Movie Net Profit or Loss | 2018 | $-500,395 | $-625,145 |
Similar Movies
| Poster | Movie | Year | Match | Overall | Est. Profit |
|---|---|---|---|---|---|
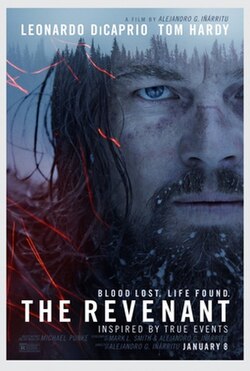 | The Revenant | 2015 | Shared genres: 3 | 95.2 | $41,194,601 |
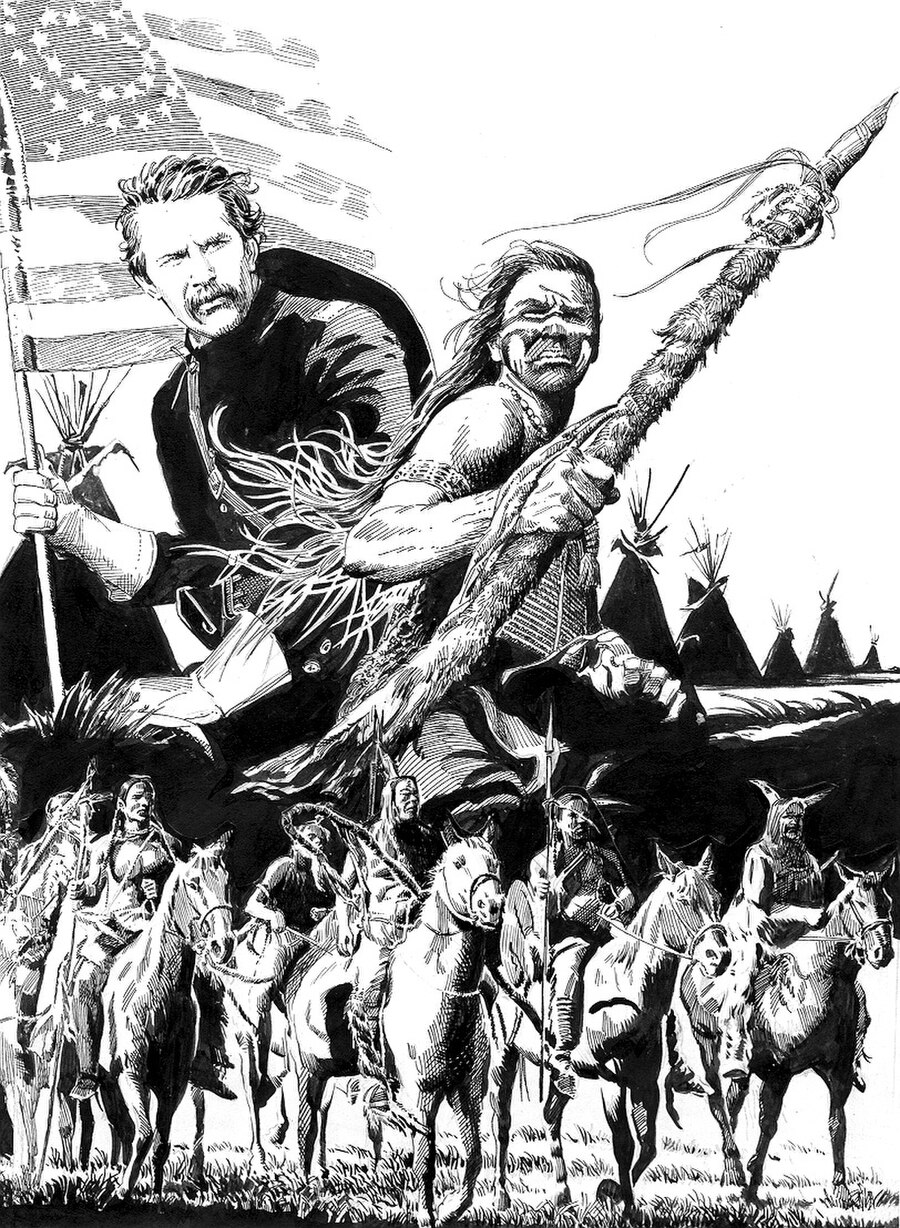 | Dances with Wolves | 1990 | Shared genres: 3 | 94.1 | $157,985,521 |
 | Rango | 2011 | Shared genres: 3 | 92.0 | $-79,708,668 |
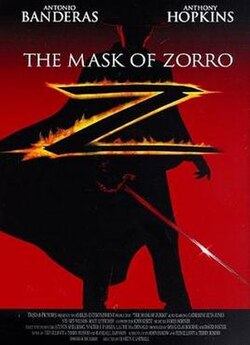 | The Mask of Zorro | 1998 | Shared genres: 3 | 91.5 | $3,576,708 |
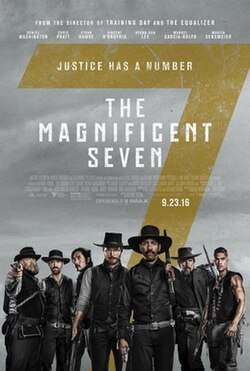 | The Magnificent Seven | 2016 | Shared genres: 3 | 88.3 | $-70,487,316 |