Synopsis
Newlywed couple Nat and Josh are deliriously happy despite their differences, though friends and family aren't convinced that they can last. With their first anniversary approaching and attractive alternatives in the mix, can they last?
Scores
Overall Score
70.0
Popularity Percentile (Year)
71.7%
Box Office Percentile (Year)
79.9%
Review Aggregate
48.8
Critic Consensus
Critic reception is mixed, with 52% of 80 logged reviews marked Fresh. Across reviews, critics repeatedly emphasize funny, romantic, emotional. Common reservations focus on execution consistency, even when reviewers praise standout elements.
funnyromanticemotionalstylizedfamily-friendlylightheartedcharacter-driven
Cast
| Cast | Year | Reported Salary | Inflation Adjusted | Notes |
|---|---|---|---|---|
| Rose Byrne | 2013 | $714,000 | $961,000 | (est) |
| Rafe Spall | 2013 | $440,000 | $592,000 | (est) |
| Anna Faris | 2013 | $331,000 | $446,000 | (est) |
| Simon Baker | 2013 | $271,000 | $364,000 | (est) |
| Stephen Merchant | 2013 | $231,000 | $312,000 | (est) |
| Minnie Driver | 2013 | $204,000 | $274,000 | (est) |
| Jason Flemyng | 2013 | $183,000 | $246,000 | (est) |
| Olivia Colman | 2013 | $167,000 | $224,000 | (est) |
Aggregated Reviews
Rotten Tomatoes critic score53.0
RT critic review count80
Rotten Tomatoes audience score38.0
RT audience rating count10,000
IMDb rating5.7
IMDb votes40,324
Box Office ?
| Category | Year | Reported | Inflation Adjusted |
|---|---|---|---|
| Domestic | 2013 | $34,657 | $46,661 |
| International | 2013 | $28,293,874 | $38,093,512 |
| Worldwide | 2013 | $28,328,531 | $38,140,172 |
Earnings / Profitability
| Category | Year | Reported | Inflation Adjusted |
|---|---|---|---|
| Revenues | |||
| Theatrical Net Revenue | 2013 | $11,334,878 | $15,260,735 |
| Digital Rentals ? | 2013 | $1,311,000 | $1,765,067 |
| Digital Purchases ? | 2013 | $784,000 | $1,055,540 |
| Physical Rentals ? | 2013 | $1,694,000 | $2,280,720 |
| Physical Purchases ? | 2013 | $4,390,000 | $5,910,485 |
| TV & Streaming Revenue | 2013 | $3,810,000 | $5,129,601 |
| Total Revenues | 2013 | $23,323,878 | $31,402,148 |
| Expenses | |||
| Budget ? | 2013 | $12,700,000 | $17,098,670 |
| Print & Advertising (P&A) ? | 2013 | $2,172,000 (est) | $2,924,276 (est) |
| Participations | 2013 | $933,000 | $1,256,146 |
| Residuals ? | 2013 | $698,000 | $939,754 |
| Interest & Overhead | 2013 | $2,540,000 | $3,419,734 |
| Total Expenses | 2013 | $19,043,000 | $25,638,580 |
| Movie Net Profit or Loss | 2013 | $4,280,878 | $5,763,568 |
Similar Movies
| Poster | Movie | Year | Match | Overall | Est. Profit |
|---|---|---|---|---|---|
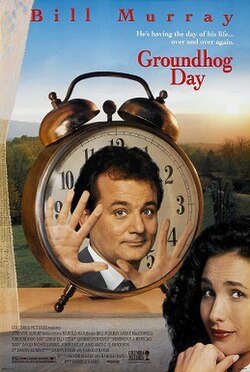 | Groundhog Day | 1993 | Shared genres: 3 | 95.4 | $78,676,439 |
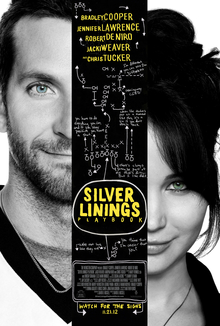 | Silver Linings Playbook | 2012 | Shared genres: 3 | 94.9 | $98,374,305 |
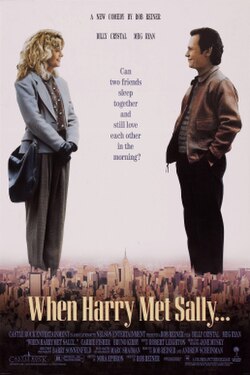 | When Harry Met Sally... | 1989 | Shared genres: 3 | 94.1 | $84,958,366 |
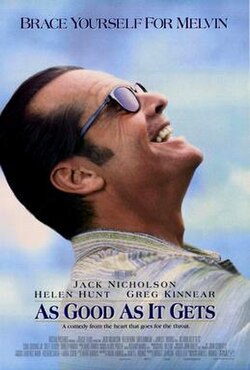 | As Good as It Gets | 1997 | Shared genres: 3 | 94.0 | $89,663,849 |
 | Coming to America | 1988 | Shared genres: 3 | 94.0 | $85,243,795 |