Screen Profits
Most Profitable Movies
Most Profitable Movies
Box Office Bombs
Movies Decade
Genres
Franchises
Actor Net Worth Rankings
Back to movie
Hands of Stone (2016) Similar Movies
20 similar titles
Similar Movies
Cinderella Man
Year
2005
Overall
91.0
Est. Profit
$-18,658,566
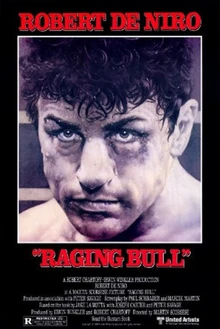
Raging Bull
Year
1980
Overall
86.4
Est. Profit
$-5,409,420
Ali
Year
2001
Overall
80.2
Est. Profit
$-29,887,384
Bleed for This
Year
2016
Overall
70.1
Est. Profit
$-5,125,575
The Fighter
Year
2010
Overall
91.8
Est. Profit
$57,534,302
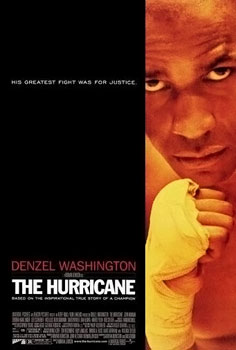
The Hurricane
Year
1999
Overall
83.7
Est. Profit
$18,308,230
Mary Kom
Year
2014
Overall
56.0
Est. Profit
$14,930,966
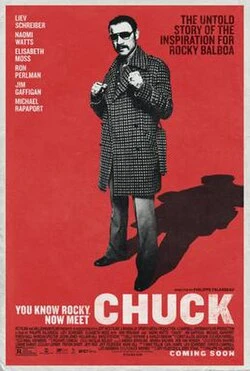
Chuck
Year
2017
Overall
54.2
Est. Profit
$8,793,806
Against the Ropes
Year
2004
Overall
53.6
Est. Profit
$-9,274,301
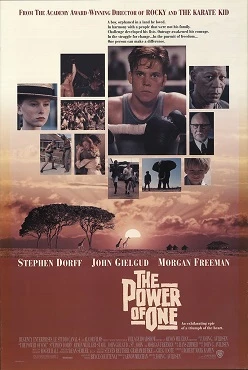
The Power of One
Year
1992
Overall
47.1
Est. Profit
$2,603,396
Triumph of the Spirit
Year
1989
Overall
30.2
Est. Profit
$-8,692,045
Million Dollar Baby
Year
2004
Overall
95.8
Est. Profit
$88,362,492
Creed
Year
2015
Overall
94.0
Est. Profit
$37,475,688
Rush
Year
2013
Overall
91.4
Est. Profit
$429,277
Creed II
Year
2018
Overall
91.3
Est. Profit
$17,811,918
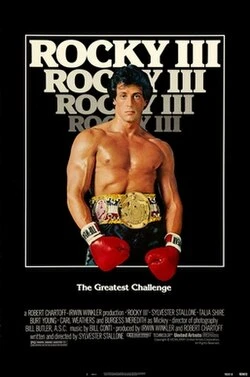
Rocky III
Year
1982
Overall
91.3
Est. Profit
$78,956,862
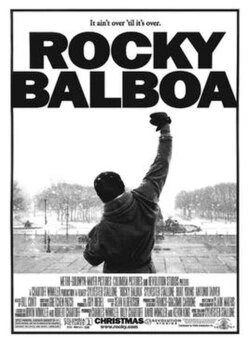
Rocky Balboa
Year
2006
Overall
90.7
Est. Profit
$75,009,440
Remember the Titans
Year
2000
Overall
90.7
Est. Profit
$84,281,478
Real Steel
Year
2011
Overall
90.5
Est. Profit
$-36,021,618
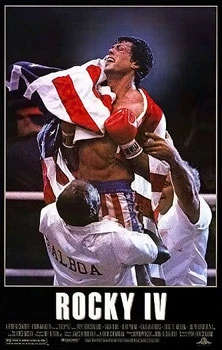
Rocky IV
Year
1985
Overall
90.1
Est. Profit
$79,019,549
 Cinderella Man