Synopsis
An elite team of Navy SEALs embark on a covert mission to recover a kidnapped CIA agent.
Scores
Overall Score
78.1
Popularity Percentile (Year)
82.1%
Box Office Percentile (Year)
87.7%
Review Aggregate
52.4
Critic Consensus
Critic reception is largely negative, with 28% of 141 logged reviews marked Fresh. Across reviews, critics repeatedly emphasize thin plot, realistic, character-driven. Many reviews cite thin plot as the main reasons it falls short.
thin plotrealisticcharacter-drivensuspensefulvisually strikinggrittyfunnycoming of agefamily-friendlypolitical
Cast
| Cast | Year | Reported Salary | Inflation Adjusted | Notes |
|---|---|---|---|---|
| U.S. Navy SEALs | 2012 | $782,000 | $1,069,000 | (est) |
| Roselyn Sánchez | 2012 | $482,000 | $658,000 | (est) |
| Jason Cottle | 2012 | $363,000 | $495,000 | (est) |
| Alex Veadov | 2012 | $296,000 | $405,000 | (est) |
| Nestor Serrano | 2012 | $254,000 | $347,000 | (est) |
| Emilio Rivera | 2012 | $223,000 | $305,000 | (est) |
Aggregated Reviews
Rotten Tomatoes critic score28.0
RT critic review count141
Rotten Tomatoes audience score72.0
RT audience rating count50,000
IMDb rating6.4
IMDb votes73,335
Box Office ?
| Category | Year | Reported | Inflation Adjusted |
|---|---|---|---|
| Domestic | 2012 | $70,012,850 | $95,657,808 |
| International | 2012 | $12,484,188 | $17,057,013 |
| Worldwide | 2012 | $82,497,030 | $112,714,810 |
Earnings / Profitability
| Category | Year | Reported | Inflation Adjusted |
|---|---|---|---|
| Revenues | |||
| Theatrical Net Revenue | 2012 | $40,000,100 | $54,651,709 |
| Digital Rentals ? | 2012 | $4,759,000 | $6,502,171 |
| Digital Purchases ? | 2012 | $2,139,000 | $2,922,493 |
| Physical Rentals ? | 2012 | $7,542,000 | $10,304,554 |
| Physical Purchases ? | 2012 | $18,633,000 | $25,458,069 |
| TV & Streaming Revenue | 2012 | $17,503,212 | $23,914,452 |
| Total Revenues | 2012 | $90,576,313 | $123,753,448 |
| Expenses | |||
| Budget ? | 2012 | $12,000,000 | $16,395,472 |
| Print & Advertising (P&A) ? source | 2012 | $30,000,000 | $40,988,679 |
| Participations | 2012 | $7,246,000 | $9,900,132 |
| Residuals ? | 2012 | $3,027,000 | $4,135,758 |
| Interest & Overhead | 2012 | $2,400,000 | $3,279,094 |
| Total Expenses | 2012 | $54,673,000 | $74,699,135 |
| Movie Net Profit or Loss | 2012 | $35,903,313 | $49,054,312 |
Similar Movies
| Poster | Movie | Year | Match | Overall | Est. Profit |
|---|---|---|---|---|---|
 | The Hunger Games: The Ballad of Songbirds & Snakes | 2023 | Shared genres: 4 | 90.2 | $11,235,824 |
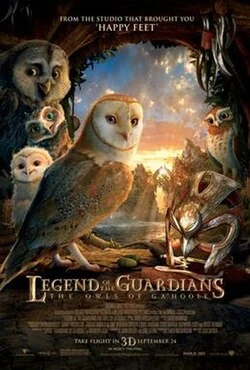 | Legend of the Guardians: The Owls of Ga'Hoole | 2010 | Shared genres: 4 | 78.5 | $-29,816,284 |
 | Wolf Warrior 2 | 2017 | Shared genres: 4 | 74.2 | $250,861,730 |
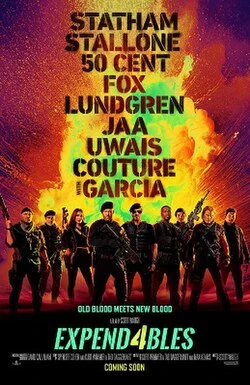 | The Expendables 4 | 2023 | Shared genres: 4 | 73.5 | $-99,619,354 |
 | Big Game | 2015 | Shared genres: 4 | 67.8 | $-346,235,366 |