Movie Box Office and Profits
Cumulative WW Box Office$386,281,469
Cumulative Profit$297,545,386
Cumulative Domestic Box Office$197,353,147
Average WW Box Office$11,361,220
Average Domestic Box Office$5,804,504
Average Profit / Loss Per Film$8,751,335
Filmography
| Poster | Movie | Year | Roles | Overall Score | Worldwide | Profit |
|---|---|---|---|---|---|---|
 | Sugarcane | 2024 | Distributor, Studio | 48.9 | $134,257 | $3,769,659 |
 | Bobi Wine: The People's President | 2023 | Distributor, Studio | 38.2 | $44,486 | $1,763,213 |
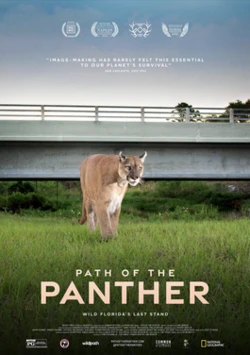 | Path of the Panther | 2023 | Production Company | 32.9 | $140,140 | $4,345,140 |
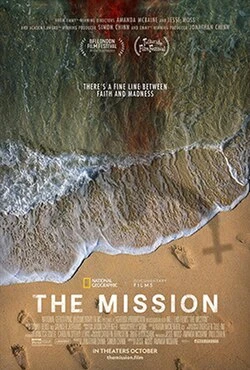 | The Mission | 2023 | Production Company | 35.5 | $69,830 | $2,924,270 |
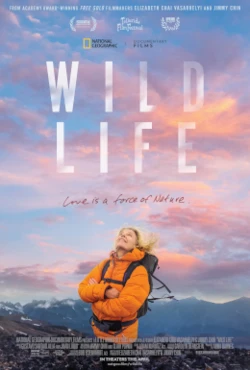 | Wild Life | 2023 | Studio | 38.9 | $326,184 | $6,307,075 |
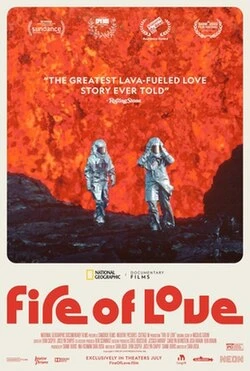 | Fire of Love | 2022 | Studio | 67.9 | $1,695,072 | $13,210,435 |
 | The Territory | 2022 | Studio | 42.7 | $87,250 | $4,944,832 |
 | Becoming Cousteau | 2021 | Production Company | 43.8 | $282,634 | $10,342,281 |
 | The First Wave | 2021 | Production Company | 37.5 | $65,239 | $6,732,333 |
 | The Rescue | 2021 | Production Company | 70.0 | $1,060,556 | $17,339,100 |
 | Torn | 2021 | Production Company | 41.4 | $62,993 | $6,309,279 |
 | Sputnik | 2020 | Production Company | 67.3 | $354,023 | $-150,711,506 |
 | The Cave | 2019 | Distributor, Studio | 43.2 | $288,764 | $3,443,568 |
 | Free Solo | 2018 | Distributor, Production Company, Studio | 87.1 | $29,390,280 | $25,984,082 |
 | Science Fair | 2018 | Distributor, Studio | 44.4 | $277,338 | $6,697,842 |
 | Jane | 2017 | Production Company, Studio | 61.5 | $1,921,221 | $13,738,578 |
 | Jerusalem | 2013 | Distributor, Studio | 49.1 | $9,279,456 | $21,354,028 |
 | Meerkats | 2012 | Distributor, Studio | 32.8 | $1,259,616 | $12,486,244 |
 | Benda Bilili! | 2011 | Distributor, Studio | 33.6 | $127,362 | $1,961,287 |
 | Desert Flower | 2011 | Distributor, Studio | 60.2 | $14,682,943 | $9,679,012 |
 | Flying Monsters 3D with David Attenborough | 2011 | Distributor, Production Company, Studio | 75.5 | $10,813,862 | $27,965,882 |
 | Life in a Day | 2011 | Distributor, Studio | 56.0 | $607,169 | $13,815,301 |
 | The First Grader | 2011 | Distributor, Production Company, Studio | 47.9 | $1,194,710 | $12,534,684 |
 | The Last Lions | 2011 | Distributor, Production Company | 47.9 | $635,325 | $15,412,699 |
 | The Way Back | 2011 | Production Company | 78.0 | $24,172,200 | $-8,319,190 |
 | Restrepo | 2010 | Distributor, Studio | 62.5 | $1,436,391 | $23,167,403 |
 | Sea Rex 3D: Journey to a Prehistoric World | 2010 | Studio | 39.7 | $16,004,150 | $21,716,951 |
 | The Wildest Dream | 2010 | Distributor, Studio | 46.4 | $898,137 | $19,427,723 |
 | Amreeka | 2009 | Distributor, Studio | 48.8 | $2,176,304 | $18,505,788 |
 | U2 3D | 2008 | Distributor, Studio | 62.6 | $22,730,842 | $16,738,873 |
 | God Grew Tired of Us | 2007 | Production Company | 49.8 | $301,447 | $19,865,975 |
 | Sea Monsters: A Prehistoric Adventure | 2007 | Distributor, Production Company, Studio | 52.2 | $50,652,464 | $41,607,847 |
 | March of the Penguins | 2005 | Production Company | 83.2 | $127,392,696 | $97,311,107 |
 | K-19: The Widowmaker | 2002 | Production Company | 75.1 | $65,716,128 | $-44,826,410 |
Basic Facts
NameNational Geographic Documentary Films
TypeCompany
Role(s)
Distributor
Production Company
Studio
Films in database34
Years in database2002-2024
Role counts
Studio: 22
Distributor: 18
Production Company: 17
Movie Data
Average Movie Score53.0
Movie Score Min32.8
Movie Score Max87.1