Movie Box Office and Profits
Cumulative WW Box Office$1,906,212,261
Cumulative Profit$-289,918,241
Cumulative Domestic Box Office$54,445,562
Average WW Box Office$61,490,718
Average Domestic Box Office$1,756,308
Average Profit / Loss Per Film$-9,352,201
Filmography
| Poster | Movie | Year | Roles | Overall Score | Worldwide | Profit |
|---|---|---|---|---|---|---|
 | Customs Frontline | 2024 | Production Company, Studio | 34.3 | $1,743,858 | $657,200 |
 | Dance First | 2024 | Production Company, Studio | 38.9 | $163,151 | $980,752 |
 | Shelter in Solitude | 2023 | Distributor | 36.7 | $235,103 | $5,357,303 |
 | Cliff Walkers | 2021 | Production Company | 65.0 | $181,325,570 | $9,827,458 |
 | Raging Fire | 2021 | Production Company, Studio | 74.0 | $205,842,400 | $50,780,056 |
 | Schemes in Antiques | 2021 | Production Company, Studio | 49.2 | $51,637,424 | $-473,822 |
 | The Rescue | 2020 | Production Company | 62.3 | $64,237,552 | $-59,553,099 |
 | Fagara | 2019 | Production Company | 48.5 | $1,265,949 | $1,121,021 |
 | A Cool Fish | 2018 | Production Company, Studio | 60.5 | $118,153,136 | $20,132,428 |
 | Namiya | 2018 | Production Company | 51.8 | $35,351,624 | $-10,949,480 |
 | Operation Red Sea | 2018 | Production Company | 76.4 | $579,330,430 | $107,711,952 |
 | Kung Fu Jungle | 2015 | Production Company, Studio | 65.2 | $24,070,764 | $-209,276,824 |
 | That Demon Within | 2014 | Production Company, Studio | 47.2 | $20,415,934 | $-33,500,660 |
 | Young Detective Dee: Rise of the Sea Dragon | 2013 | Studio | 60.6 | $98,774,890 | $-11,777,555 |
 | Let the Bullets Fly | 2012 | Studio | 71.2 | $104,723,310 | $24,314,128 |
 | The Bullet Vanishes | 2012 | Production Company, Studio | 47.9 | $1,528,580 | $-9,028,991 |
 | The Viral Factor | 2012 | Production Company, Studio | 48.7 | $5,687,319 | $-211,699,800 |
 | Detective Dee: The Mystery of the Phantom Flame | 2011 | Studio | 64.3 | $51,899,268 | $5,417,822 |
 | Oranges and Sunshine | 2011 | Production Company | 54.1 | $5,017,653 | $5,751,549 |
 | Shaolin | 2011 | Production Company, Studio | 67.9 | $42,741,496 | $-2,236,502 |
 | Tyrannosaur | 2011 | Production Company | 60.6 | $676,111 | $3,262,676 |
 | What Women Want | 2011 | Production Company, Studio | 41.0 | $11,838,177 | $6,270,386 |
 | Aftershock | 2010 | Production Company | 69.0 | $100,293,270 | $21,670,605 |
 | Bronson | 2009 | Production Company | 66.4 | $2,260,712 | $15,184,272 |
 | Donkey Punch | 2009 | Production Company | 45.3 | $694,422 | $3,676,706 |
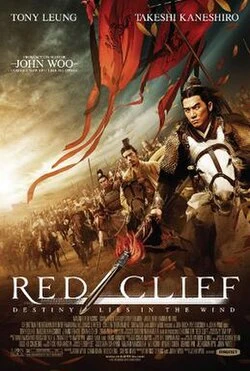 | Red Cliff | 2009 | Production Company | 75.7 | $129,708,430 | $-25,489,563 |
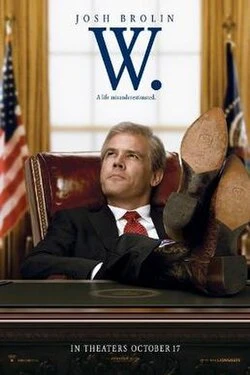 | W. | 2008 | Production Company | 73.7 | $29,560,588 | $575,962 |
 | When Did You Last See Your Father? | 2008 | Production Company | 59.5 | $2,752,471 | $19,700,025 |
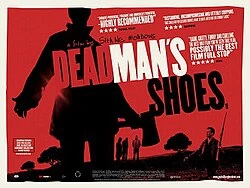 | Dead Man's Shoes | 2006 | Production Company | 49.3 | $11,777 | $1,858,652 |
 | George Bush Goes to Heaven | 2006 | Production Company | 44.7 | $2,192 | $-21,702,904 |
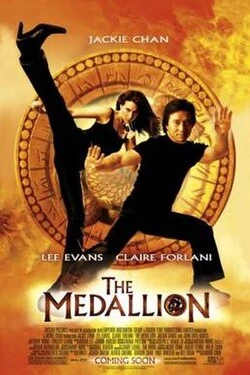 | The Medallion | 2003 | Production Company | 67.4 | $34,268,700 | $1,520,006 |
Basic Facts
NameEmperor Motion Pictures
TypeCompany
Role(s)
Distributor
Production Company
Studio
Films in database31
Years in database2003-2024
Role counts
Production Company: 27
Studio: 14
Distributor: 1
Movie Data
Average Movie Score57.3
Movie Score Min34.3
Movie Score Max76.4