Movie Box Office and Profits
Cumulative WW Box Office$129,609,352
Cumulative Profit$89,931,574
Cumulative Domestic Box Office$74,648,738
Average WW Box Office$18,515,622
Average Domestic Box Office$10,664,105
Average Profit / Loss Per Film$12,847,368
Filmography
| Poster | Movie | Year | Roles | Overall Score | Worldwide | Profit |
|---|---|---|---|---|---|---|
 | Wake in Fright | 2012 | Production Company | 40.1 | $50,590 | $6,885,197 |
 | The Men Who Stare at Goats | 2009 | Production Company | 74.3 | $69,095,770 | $27,544,177 |
 | Wake | 2004 | Production Company | 33.0 | $7,212 | $1,499,606 |
 | Scorched | 2003 | Studio | 43.6 | $363,057 | $-4,642,977 |
 | Greenfingers | 2001 | Studio | 45.4 | $1,961,054 | $21,427,955 |
 | Heartbreakers | 2001 | Studio | 72.2 | $57,756,408 | $29,767,376 |
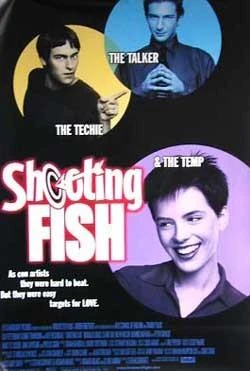 | Shooting Fish | 1998 | Production Company | 38.1 | $375,261 | $7,450,240 |
Basic Facts
NameWinchester Capital Partners
TypeCompany
Role(s)
Production Company
Studio
Films in database7
Years in database1998-2012
Role counts
Production Company: 4
Studio: 3
Movie Data
Average Movie Score49.5
Movie Score Min33.0
Movie Score Max74.3