Movie Box Office and Profits
Cumulative WW Box Office$1,892,151,788
Cumulative Profit$-508,003,006
Cumulative Domestic Box Office$959,663,857
Average WW Box Office$118,259,487
Average Domestic Box Office$59,978,991
Average Profit / Loss Per Film$-31,750,188
Filmography
| Poster | Movie | Year | Roles | Overall Score | Worldwide | Profit |
|---|---|---|---|---|---|---|
 | Beetlejuice Beetlejuice | 2024 | Production Company | 91.3 | $452,000,450 | $80,449,351 |
 | Dumbo | 2019 | Production Company | 83.4 | $353,284,600 | $-69,587,944 |
 | Alice Through the Looking Glass | 2016 | Production Company | 82.4 | $299,457,020 | $-174,768,702 |
 | The Looking Glass | 2015 | Production Company | 38.8 | $1,711 | $-142,653,144 |
 | Anything for Alice | 2014 | Production Company | 59.1 | $3,387,582 | $-142,353,858 |
 | Big Eyes | 2014 | Production Company | 80.8 | $29,253,166 | $12,981,157 |
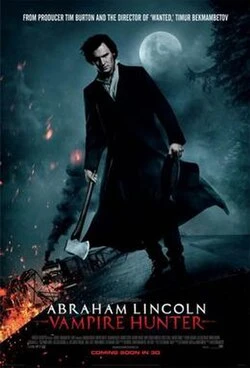 | Abraham Lincoln: Vampire Hunter | 2012 | Production Company | 81.7 | $116,471,584 | $-28,981,669 |
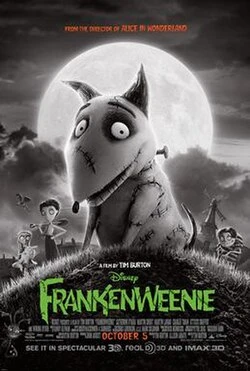 | Frankenweenie | 2012 | Production Company | 84.1 | $81,491,070 | $-6,686,699 |
 | The Hunter | 2012 | Production Company | 66.3 | $1,680,778 | $-100,042,687 |
 | Bride Flight | 2011 | Production Company | 70.7 | $501,360 | $-27,301,749 |
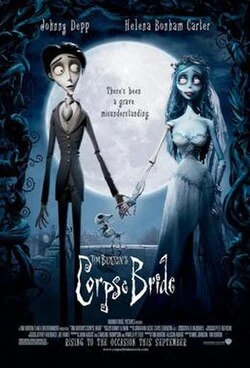 | Corpse Bride | 2005 | Production Company | 91.3 | $117,195,064 | $17,662,715 |
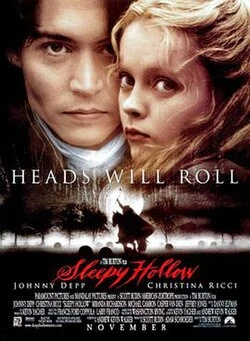 | Sleepy Hollow | 1999 | Production Company | 91.9 | $206,071,500 | $18,590,773 |
 | Mars Attacks! | 1996 | Production Company | 84.9 | $37,771,980 | $-34,188,738 |
 | Batman Forever | 1995 | Production Company | 85.8 | $184,033,490 | $63,888,258 |
 | Cabin Boy | 1994 | Production Company | 40.9 | $3,662,459 | $13,067,213 |
 | Ed Wood | 1994 | Production Company | 72.6 | $5,887,974 | $11,922,718 |
Basic Facts
NameTim Burton Productions
TypeCompany
Role(s)
Production Company
Films in database16
Years in database1994-2024
Role counts
Production Company: 16
Movie Data
Average Movie Score75.4
Movie Score Min38.8
Movie Score Max91.9