Movie Box Office and Profits
Cumulative WW Box Office$1,215,282,887
Cumulative Profit$624,627,134
Cumulative Domestic Box Office$631,888,453
Average WW Box Office$32,845,483
Average Domestic Box Office$17,078,066
Average Profit / Loss Per Film$16,881,814
Filmography
| Poster | Movie | Year | Roles | Overall Score | Worldwide | Profit |
|---|---|---|---|---|---|---|
 | Locked | 2025 | Production Company | 66.3 | $4,647,059 | $-1,454,197 |
 | Best F(r)iends Volume Two | 2018 | Production Company | 35.6 | $141,524 | $5,213,524 |
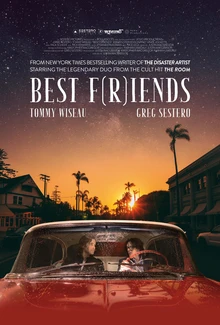
 | Best F(r)iends: Volume 1 | 2018 | Production Company | 43.7 | $290,064 | $6,803,051 |
 | The Strangers: Prey at Night | 2018 | Production Company | 73.4 | $31,039,126 | $22,745,131 |
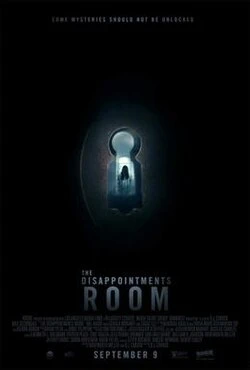 | The Disappointments Room | 2016 | Studio | 52.6 | $5,745,040 | $-4,921,250 |
 | Movie 43 | 2013 | Production Company | 70.1 | $32,438,988 | $23,256,350 |
 | Limitless | 2011 | Production Company | 91.2 | $161,849,460 | $54,462,092 |
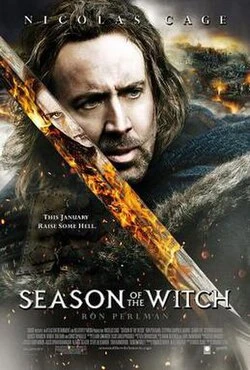 | Season of the Witch | 2011 | Studio | 73.8 | $91,627,230 | $-5,423,851 |
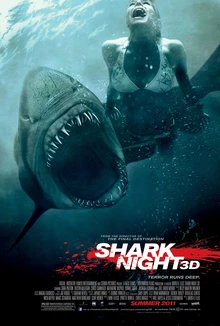 | Shark Night | 2011 | Studio | 63.5 | $41,363,928 | $3,222,802 |
 | Strangers Online | 2011 | Production Company | 50.0 | $968 | $-8,241,516 |
 | Take Me Home Tonight | 2011 | Production Company | 63.5 | $7,550,073 | $-11,333,937 |
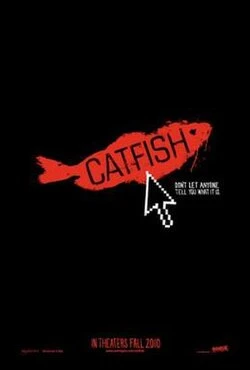 | Catfish | 2010 | Distributor, Production Company | 65.0 | $3,533,711 | $28,399,156 |
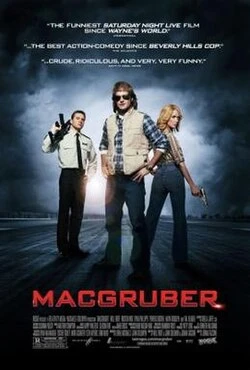 | MacGruber | 2010 | Production Company | 66.7 | $9,322,895 | $15,987,862 |
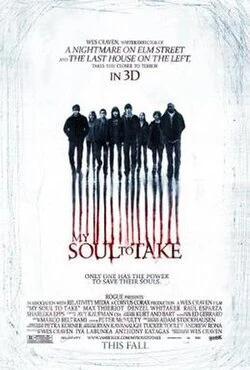 | My Soul to Take | 2010 | Production Company | 58.9 | $21,500,812 | $2,562,433 |
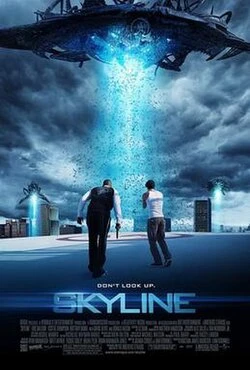 | Skyline | 2010 | Production Company | 68.5 | $66,984,888 | $37,980,786 |
 | The Kids Grow Up | 2010 | Production Company | 37.7 | $12,095 | $3,807,095 |
 | The Warrior's Way | 2010 | Studio | 61.4 | $11,103,434 | $-21,860,456 |
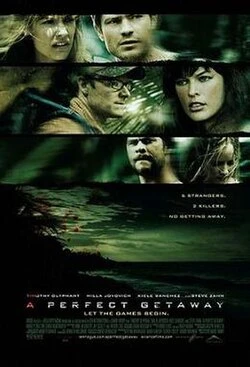 | A Perfect Getaway | 2009 | Production Company | 71.2 | $22,938,328 | $13,813,588 |
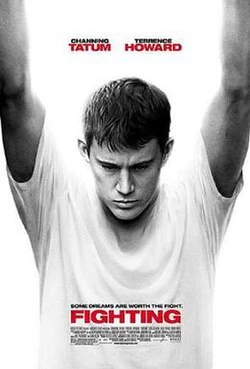 | Fighting | 2009 | Production Company | 72.3 | $32,482,728 | $11,010,035 |
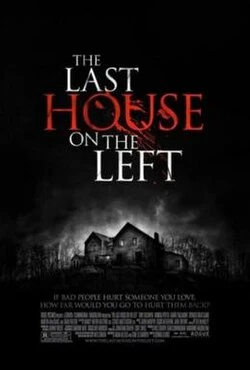 | The Last House on the Left | 2009 | Production Company | 77.3 | $45,289,052 | $31,366,897 |
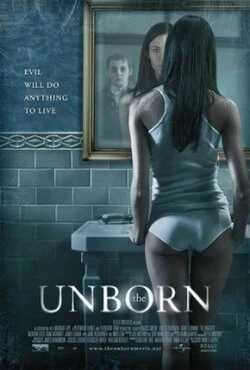 | The Unborn | 2009 | Production Company | 73.0 | $76,514,050 | $41,628,262 |
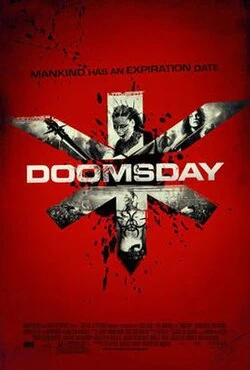 | Doomsday | 2008 | Distributor, Production Company | 71.3 | $22,472,632 | $13,285,034 |
 | The Strangers | 2008 | Distributor, Production Company | 83.0 | $82,410,456 | $64,883,344 |
 | Balls of Fury | 2007 | Distributor, Studio | 73.5 | $41,739,112 | $19,756,953 |
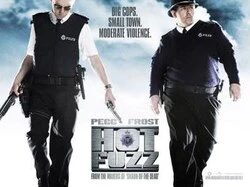 | Hot Fuzz | 2007 | Distributor | 92.8 | $80,577,264 | $39,094,575 |
 | The Hitcher | 2007 | Distributor, Studio | 72.8 | $25,399,944 | $30,190,785 |
 | Dave Chappelle's Block Party | 2006 | Distributor, Studio | 69.8 | $12,051,924 | $35,227,092 |
 | Fearless | 2006 | Distributor | 82.0 | $68,072,850 | $-44,462,392 |
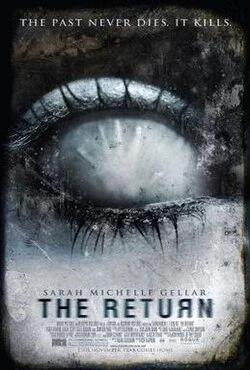 | The Return | 2006 | Distributor, Studio | 62.9 | $11,992,014 | $18,351,755 |
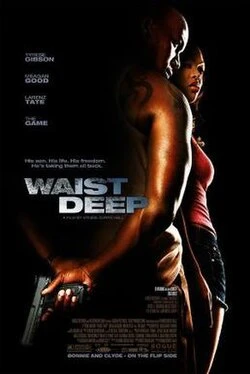 | Waist Deep | 2006 | Distributor | 66.4 | $21,353,304 | $22,079,787 |
 | Assault on Precinct 13 | 2005 | Distributor | 72.9 | $35,294,472 | $15,543,693 |
 | Cry Wolf | 2005 | Distributor, Studio | 66.1 | $32,586,408 | $50,511,772 |
 | Unleashed | 2005 | Distributor | 78.1 | $50,871,112 | $4,508,236 |
 | Seed of Chucky | 2004 | Distributor | 71.8 | $24,829,644 | $33,144,326 |
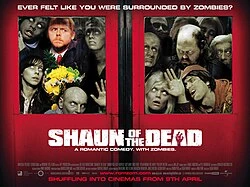 | Shaun of the Dead | 2004 | Distributor | 89.7 | $30,168,182 | $44,643,639 |
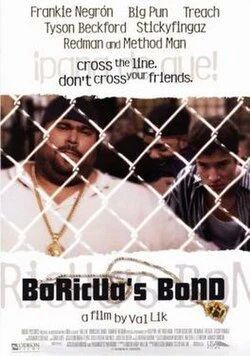 | Boricua's Bond | 2000 | Production Company | 11.4 | $71,046 | $3,379,046 |
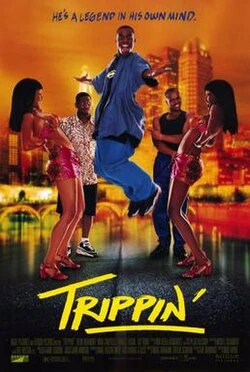 | Trippin' | 1999 | Studio | 40.9 | $9,017,070 | $25,465,632 |
Basic Facts
NameRoguescots
TypeCompany
Role(s)
Distributor
Production Company
Studio
Films in database37
Years in database1999-2025
Role counts
Production Company: 20
Distributor: 15
Studio: 10
Movie Data
Average Movie Score66.0
Movie Score Min11.4
Movie Score Max92.8