Movie Box Office and Profits
Cumulative WW Box Office$2,495,181,353
Cumulative Profit$1,066,583,446
Cumulative Domestic Box Office$1,512,103,793
Average WW Box Office$71,290,896
Average Domestic Box Office$43,202,966
Average Profit / Loss Per Film$30,473,813
Filmography
| Poster | Movie | Year | Roles | Overall Score | Worldwide | Profit |
|---|---|---|---|---|---|---|
 | The Innocent | 2023 | Production Company | 69.1 | $5,319,113 | $-15,514,873 |
 | Seondal: The Man Who Sells the River | 2016 | Production Company | 46.4 | $14,777,982 | $223,879 |
 | The Revenant | 2015 | Production Company | 95.2 | $532,950,500 | $41,194,594 |
 | Birdman or (The Unexpected Virtue of Ignorance) | 2014 | Production Company | 92.6 | $103,215,096 | $30,578,248 |
 | Margaret | 2011 | Production Company | 51.8 | $469,264 | $-5,151,682 |
 | Leatherheads | 2008 | Production Company | 73.7 | $41,319,040 | $-22,532,506 |
 | The Reader | 2008 | Production Company | 87.1 | $108,902,490 | $28,280,038 |
 | Michael Clayton | 2007 | Production Company | 89.2 | $92,991,830 | $42,497,591 |
 | Breaking and Entering | 2006 | Production Company | 63.7 | $8,974,829 | $10,641,166 |
 | Catch a Fire | 2006 | Production Company | 62.6 | $5,710,236 | $14,844,981 |
 | Innocent Voices | 2005 | Production Company | 61.6 | $7,015,131 | $4,787,991 |
 | The Interpreter | 2005 | Production Company | 80.2 | $162,944,930 | $17,543,824 |
 | Cold Mountain | 2003 | Production Company | 86.6 | $173,013,500 | $33,655,278 |
 | Blow Dry | 2001 | Production Company | 42.3 | $830,286 | $16,845,399 |
 | Iris | 2001 | Production Company | 59.6 | $16,153,953 | $27,815,890 |
 | Up at the Villa | 2000 | Production Company | 41.0 | $3,740,113 | $19,164,826 |
 | Random Hearts | 1999 | Production Company | 62.7 | $74,608,570 | $-5,060,667 |
 | The Talented Mr. Ripley | 1999 | Production Company | 89.7 | $128,798,264 | $58,637,646 |
 | Sliding Doors | 1998 | Production Company | 69.7 | $11,841,544 | $31,064,743 |
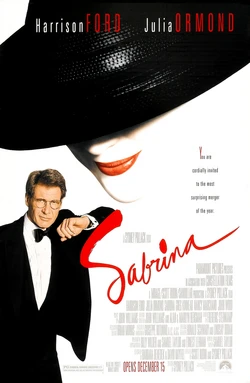 | Sabrina | 1995 | Production Company | 76.3 | $53,696,280 | $26,374,739 |
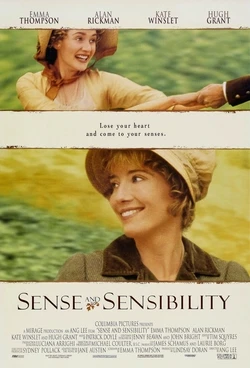 | Sense and Sensibility | 1995 | Production Company | 87.3 | $43,184,364 | $71,836,082 |
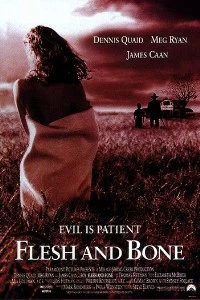 | Flesh and Bone | 1993 | Production Company | 44.2 | $9,709,451 | $17,567,994 |
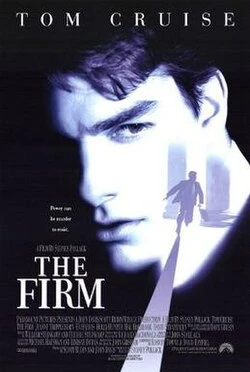 | The Firm | 1993 | Production Company | 87.8 | $158,348,370 | $112,744,729 |
 | Leaving Normal | 1992 | Production Company | 26.6 | $1,514,114 | $11,969,503 |
 | King Ralph | 1991 | Production Company | 65.1 | $34,002,044 | $52,492,533 |
 | Havana | 1990 | Production Company | 45.8 | $9,243,140 | $-13,871,076 |
 | Presumed Innocent | 1990 | Production Company | 82.8 | $86,303,184 | $83,573,484 |
 | White Palace | 1990 | Production Company | 54.9 | $17,487,532 | $29,011,849 |
 | Major League | 1989 | Production Company | 84.9 | $49,797,488 | $67,508,861 |
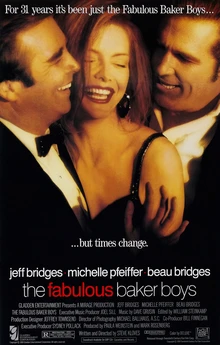 | The Fabulous Baker Boys | 1989 | Production Company | 72.0 | $18,428,904 | $33,376,678 |
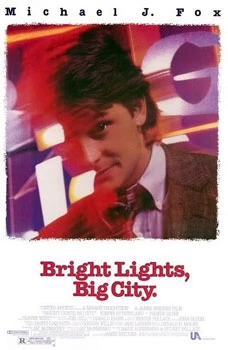 | Bright Lights, Big City | 1988 | Production Company | 58.8 | $16,118,077 | $9,327,558 |
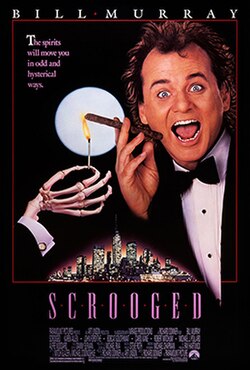 | Scrooged | 1988 | Production Company | 88.4 | $60,328,560 | $43,078,277 |
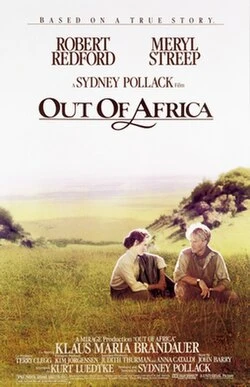 | Out of Africa | 1985 | Production Company | 87.4 | $225,526,210 | $76,118,548 |
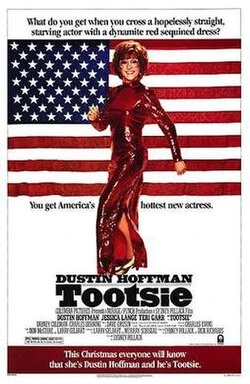 | Tootsie | 1982 | Production Company | 88.6 | $177,200,000 | $99,805,000 |
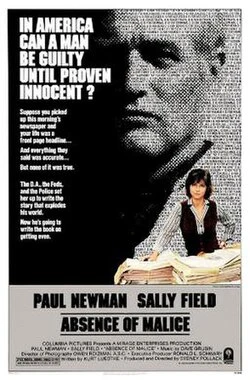 | Absence of Malice | 1981 | Production Company | 70.0 | $40,716,964 | $16,152,323 |
Basic Facts
NameMirage Productions
TypeCompany
Role(s)
Production Company
Films in database35
Years in database1981-2023
Role counts
Production Company: 35
Movie Data
Average Movie Score69.9
Movie Score Min26.6
Movie Score Max95.2