Movie Box Office and Profits
Cumulative WW Box Office$2,345,982,359
Cumulative Profit$-192,640,773
Cumulative Domestic Box Office$1,140,013,365
Average WW Box Office$60,153,394
Average Domestic Box Office$29,231,112
Average Profit / Loss Per Film$-4,939,507
Filmography
| Poster | Movie | Year | Roles | Overall Score | Worldwide | Profit |
|---|---|---|---|---|---|---|
 | Here | 2024 | Production Company | 72.4 | $15,891,756 | $-50,404,626 |
 | The Witches | 2021 | Production Company | 74.1 | $29,303,572 | $-46,419,479 |
 | Welcome to Marwen | 2018 | Production Company | 70.3 | $13,061,491 | $-94,203,807 |
 | Blackbird | 2015 | Distributor | 30.2 | $78,400 | $6,348,400 |
 | Digging Up the Marrow | 2015 | Studio | 35.1 | $10,969 | $2,305,484 |
 | Life in a Walk | 2015 | Production Company | 49.9 | $16,557 | $3,358,278 |
 | The Walk | 2015 | Production Company | 74.4 | $61,181,944 | $-15,699,473 |
 | Aftermath | 2014 | Studio | 20.8 | $3,451 | $287,726 |
 | The Expedition to the End of the World | 2014 | Production Company, Studio | 54.3 | $39,115 | $6,667,558 |
 | Winnie Mandela | 2013 | Distributor, Studio | 35.1 | $80,634 | $-8,478,366 |
 | Flight | 2012 | Production Company | 90.5 | $161,772,370 | $43,727,282 |
 | Home Run Showdown | 2012 | Distributor | 14.8 | $8,824 | $1,479,412 |
 | Lovely Molly | 2012 | Distributor, Studio | 47.8 | $274,480 | $3,940,638 |
 | 35 and Ticking | 2011 | Distributor, Studio | 34.6 | $113,794 | $9,797,794 |
 | Every Day | 2011 | Distributor | 42.7 | $46,029 | $4,974,014 |
 | Mars Needs Moms | 2011 | Production Company | 65.1 | $39,233,680 | $-140,604,991 |
 | Passion Play | 2011 | Distributor, Studio | 28.7 | $25,603 | $-13,270,392 |
 | The Double | 2011 | Distributor, Studio | 56.4 | $4,729,855 | $-3,087,305 |
 | The Way Back | 2011 | Studio | 78.0 | $24,172,200 | $-8,319,190 |
 | 44 Inch Chest | 2010 | Distributor | 45.9 | $294,245 | $7,569,001 |
 | Don McKay | 2010 | Distributor, Studio | 25.1 | $13,722 | $889,861 |
 | The Perfect Game | 2010 | Studio | 55.1 | $3,878,993 | $5,693,133 |
 | A Christmas Carol | 2009 | Production Company | 85.5 | $325,286,660 | $-58,357,117 |
 | Dare | 2009 | Distributor, Studio | 39.0 | $18,000 | $4,173,000 |
 | Management | 2009 | Production Company | 56.3 | $2,555,950 | $20,464,309 |
 | The Other Man | 2009 | Distributor | 43.7 | $2,138,350 | $11,505,657 |
 | Encounters at the End of the World | 2008 | Production Company, Studio | 62.3 | $1,205,464 | $22,932,452 |
 | My Name Is Bruce | 2008 | Distributor, Studio | 47.8 | $173,066 | $14,790,413 |
 | Stuck | 2008 | Studio | 44.5 | $151,449 | $10,181,330 |
 | Beowulf | 2007 | Production Company | 87.4 | $196,393,740 | $-94,471,300 |
 | Last Holiday | 2006 | Production Company | 79.3 | $43,451,848 | $-14,608,276 |
 | Monster House | 2006 | Production Company | 83.7 | $141,861,250 | $14,220,850 |
 | The Holiday | 2006 | Production Company | 90.1 | $205,166,460 | $17,559,764 |
 | Hate Crime | 2005 | Studio | 27.7 | $40,758 | $8,685,379 |
 | The Prize Winner of Defiance, Ohio | 2005 | Production Company | 52.8 | $689,028 | $12,177,533 |
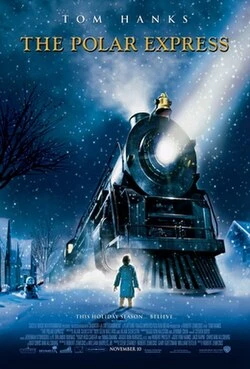 | The Polar Express | 2004 | Production Company | 86.4 | $286,000,500 | $-76,574,162 |
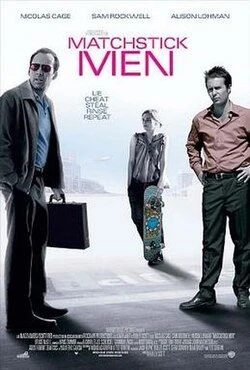 | Matchstick Men | 2003 | Production Company | 83.5 | $65,565,672 | $-1,709,470 |
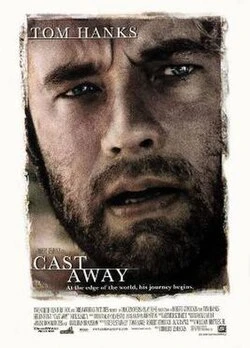 | Cast Away | 2000 | Production Company | 95.9 | $429,632,130 | $128,725,319 |
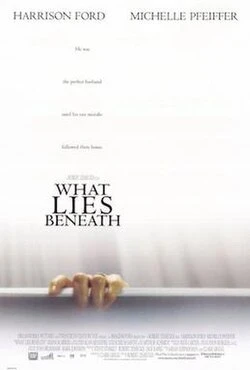 | What Lies Beneath | 2000 | Production Company | 86.1 | $291,420,350 | $71,112,593 |
Basic Facts
NameImageMovers Digital
TypeCompany
Role(s)
Distributor
Production Company
Studio
Films in database39
Years in database2000-2024
Role counts
Production Company: 20
Studio: 16
Distributor: 13
Movie Data
Average Movie Score57.8
Movie Score Min14.8
Movie Score Max95.9