Movie Box Office and Profits
Cumulative WW Box Office$354,409,599
Cumulative Profit$276,464,495
Cumulative Domestic Box Office$157,258,441
Average WW Box Office$39,378,844
Average Domestic Box Office$17,473,160
Average Profit / Loss Per Film$30,718,277
Filmography
| Poster | Movie | Year | Roles | Overall Score | Worldwide | Profit |
|---|---|---|---|---|---|---|
 | The White Storm 2: Drug Lords | 2019 | Production Company | 61.2 | $189,396,380 | $40,053,468 |
 | London Fields | 2018 | Production Company | 51.5 | $487,420 | $-1,530,060 |
 | 360 | 2012 | Production Company | 55.6 | $4,396,975 | $5,872,996 |
 | The Killer Inside Me | 2010 | Production Company | 58.7 | $4,050,140 | $589,558 |
 | A Nightmare on Elm Street: The Dream Child | 1989 | Production Company | 72.9 | $22,168,360 | $47,714,270 |
 | A Nightmare on Elm Street 4: The Dream Master | 1988 | Production Company | 83.4 | $49,369,900 | $65,062,425 |
 | A Nightmare on Elm Street 3: Dream Warriors | 1987 | Production Company | 87.1 | $44,793,224 | $59,823,918 |
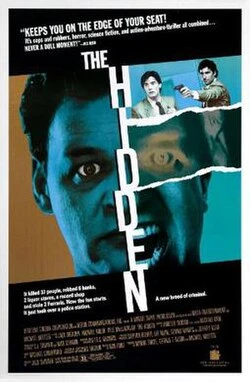 | The Hidden | 1987 | Production Company | 64.1 | $9,747,988 | $17,765,511 |
 | A Nightmare on Elm Street 2: Freddy's Revenge | 1985 | Production Company | 80.3 | $29,999,212 | $41,112,409 |
Basic Facts
NameHeron Communications, Inc.
TypeCompany
Role(s)
Production Company
Films in database9
Years in database1985-2019
Role counts
Production Company: 9
Movie Data
Average Movie Score68.3
Movie Score Min51.5
Movie Score Max87.1