Movie Box Office and Profits
Cumulative WW Box Office$76,170,972
Cumulative Profit$-8,809,916
Cumulative Domestic Box Office$32,457,819
Average WW Box Office$9,521,372
Average Domestic Box Office$4,057,227
Average Profit / Loss Per Film$-1,101,239
Filmography
| Poster | Movie | Year | Roles | Overall Score | Worldwide | Profit |
|---|---|---|---|---|---|---|
 | Life Upside Down | 2023 | Production Company | 17.0 | $7,017 | $-170,746 |
 | My Cousin Rachel | 2017 | Production Company | 69.0 | $9,200,168 | $357,851 |
 | The Beguiled | 2017 | Production Company | 78.5 | $27,869,128 | $7,476,050 |
 | Le Week-End | 2014 | Production Company | 63.7 | $8,652,213 | $11,021,834 |
 | Hyde Park on Hudson | 2012 | Production Company | 60.5 | $10,980,481 | $10,143,665 |
 | Venus | 2006 | Production Company | 62.2 | $7,261,490 | $26,375,302 |
 | Enduring Love | 2004 | Production Company | 56.2 | $1,828,184 | $20,452,422 |
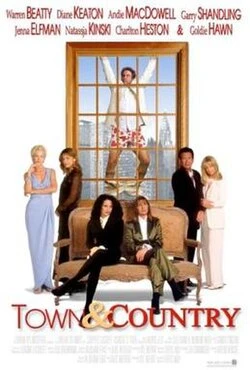 | Town & Country | 2001 | Production Company | 38.8 | $10,372,291 | $-84,466,293 |
Basic Facts
NameFree Range Films
TypeCompany
Role(s)
Production Company
Films in database8
Years in database2001-2023
Role counts
Production Company: 8
Movie Data
Average Movie Score55.7
Movie Score Min17.0
Movie Score Max78.5