Movie Box Office and Profits
Cumulative WW Box Office$1,591,051,149
Cumulative Profit$-371,631,978
Cumulative Domestic Box Office$721,616,576
Average WW Box Office$99,440,697
Average Domestic Box Office$45,101,036
Average Profit / Loss Per Film$-23,226,999
Filmography
| Poster | Movie | Year | Roles | Overall Score | Worldwide | Profit |
|---|---|---|---|---|---|---|
 | Ferrari | 2023 | Production Company | 80.4 | $43,601,124 | $-90,218,541 |
 | Blackhat | 2015 | Production Company | 69.7 | $19,652,056 | $-66,323,144 |
 | Blackhats | 2015 | Production Company | 31.6 | $3,216 | $-60,485,392 |
 | The Salvation | 2015 | Production Company | 66.1 | $1,363,964 | $-3,299,924 |
 | Texas Killing Fields | 2011 | Production Company | 52.0 | $1,271,319 | $5,888,874 |
 | Public Enemies | 2009 | Production Company | 89.3 | $214,104,620 | $7,444,468 |
 | Hancock | 2008 | Production Company | 89.9 | $629,443,460 | $73,358,951 |
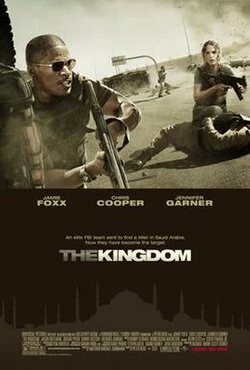 | The Kingdom | 2007 | Production Company | 85.2 | $87,019,160 | $-14,820,466 |
 | Miami Vice | 2006 | Production Company | 83.9 | $163,794,510 | $-44,009,530 |
 | In the Realms of the Unreal | 2004 | Studio | 46.2 | $417,120 | $22,636,150 |
 | The Aviator | 2004 | Production Company | 91.9 | $213,719,940 | $10,296,904 |
 | The Best Two Years | 2004 | Production Company | 68.6 | $1,163,450 | $-90,066,895 |
 | The Intended | 2004 | Production Company | 54.1 | $16,290 | $-89,375,673 |
 | Ali | 2001 | Production Company | 80.2 | $87,713,824 | $-29,887,384 |
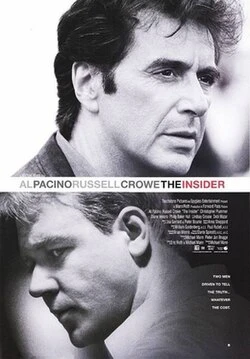 | The Insider | 1999 | Production Company | 86.9 | $60,289,912 | $-41,359,566 |
 | Heat | 1995 | Production Company | 93.0 | $67,477,184 | $38,589,190 |
Basic Facts

NameForward Pass
TypeCompany
Role(s)
Production Company
Studio
Films in database16
Years in database1995-2023
Role counts
Production Company: 15
Studio: 1
Movie Data
Average Movie Score73.1
Movie Score Min31.6
Movie Score Max93.0