Movie Box Office and Profits
Cumulative WW Box Office$632,655,833
Cumulative Profit$132,614,355
Cumulative Domestic Box Office$242,957,385
Average WW Box Office$42,177,056
Average Domestic Box Office$16,197,159
Average Profit / Loss Per Film$8,840,957
Filmography
| Poster | Movie | Year | Roles | Overall Score | Worldwide | Profit |
|---|---|---|---|---|---|---|
 | Afraid | 2024 | Production Company | 66.5 | $12,977,758 | $-6,416,053 |
 | About My Father | 2023 | Production Company | 70.2 | $18,167,820 | $-15,405,679 |
 | Moving On | 2023 | Production Company | 37.1 | $2,136,832 | $6,026,349 |
 | The Farewell | 2019 | Production Company | 84.7 | $23,076,656 | $22,657,228 |
 | Bel Canto | 2018 | Production Company | 46.0 | $358,048 | $5,152,761 |
 | Columbus | 2017 | Production Company | 66.7 | $1,094,217 | $11,990,240 |
 | Grandma | 2015 | Production Company | 69.1 | $7,205,073 | $22,732,291 |
 | Admission | 2013 | Production Company | 68.3 | $18,637,200 | $8,043,367 |
 | Being Flynn | 2012 | Production Company | 54.1 | $983,124 | $15,132,929 |
 | A Single Man | 2009 | Production Company | 75.6 | $24,964,890 | $24,988,796 |
 | Cirque du Freak: The Vampire's Assistant | 2009 | Production Company | 73.8 | $39,291,384 | $-18,631,812 |
 | Nick and Norah's Infinite Playlist | 2008 | Production Company | 79.0 | $33,556,632 | $33,361,204 |
 | The Golden Compass | 2007 | Production Company | 86.5 | $372,234,880 | $-26,589,346 |
 | American Dreamz | 2006 | Production Company | 64.2 | $16,656,103 | $14,927,663 |
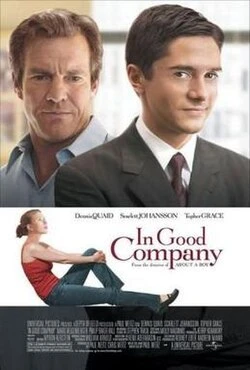 | In Good Company | 2004 | Production Company | 77.9 | $61,315,216 | $34,644,417 |
Basic Facts

NameDepth of Field
TypeCompany
Role(s)
Production Company
Films in database15
Years in database2004-2024
Role counts
Production Company: 15
Movie Data
Average Movie Score68.0
Movie Score Min37.1
Movie Score Max86.5