Movie Box Office and Profits
Cumulative WW Box Office$256,874,295
Cumulative Profit$190,360,788
Cumulative Domestic Box Office$236,105,765
Average WW Box Office$18,348,164
Average Domestic Box Office$16,864,698
Average Profit / Loss Per Film$13,597,199
Filmography
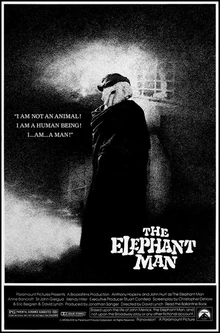
| Poster | Movie | Year | Roles | Overall Score | Worldwide | Profit |
|---|---|---|---|---|---|---|
 | Benjamin the Elephant | 2020 | Production Company | 79.0 | $2,086,431 | $-3,717,423 |
 | The Producers | 2005 | Production Company | 78.3 | $38,075,320 | $3,292,628 |
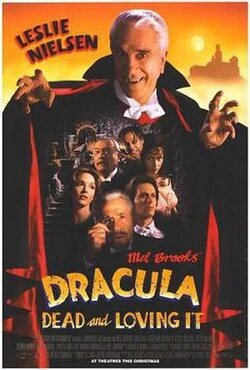 | Dracula: Dead and Loving It | 1995 | Production Company | 60.5 | $10,772,144 | $10,007,387 |
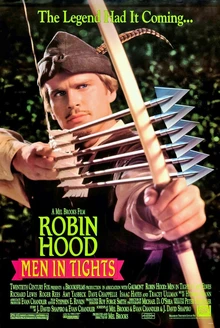 | Robin Hood: Men in Tights | 1993 | Production Company | 83.9 | $35,739,756 | $60,943,817 |
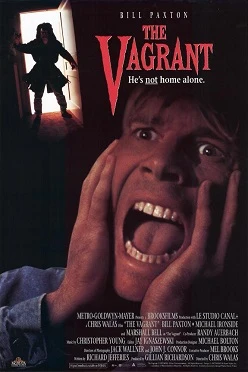 | The Vagrant | 1992 | Production Company | 16.1 | $5,900 | $-71,050 |
 | Life Stinks | 1991 | Production Company | 48.6 | $4,102,526 | $10,030,273 |
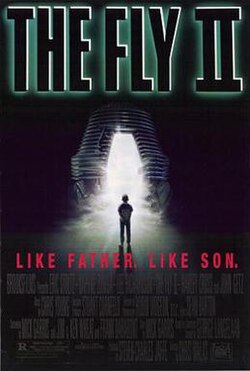 | The Fly II | 1989 | Production Company | 63.6 | $20,021,322 | $35,593,992 |
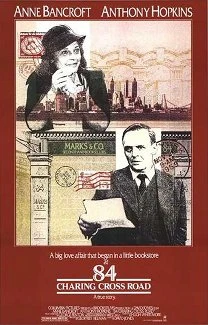 | 84 Charing Cross Road | 1987 | Production Company | 48.5 | $1,083,486 | $3,896,737 |
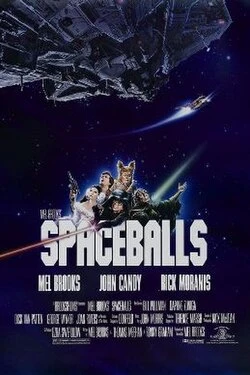 | Spaceballs | 1987 | Production Company | 87.0 | $38,120,460 | $29,588,613 |
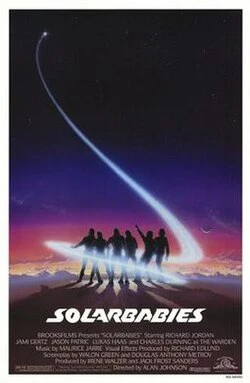 | Solarbabies | 1986 | Production Company | 28.1 | $1,579,260 | $-23,413,666 |
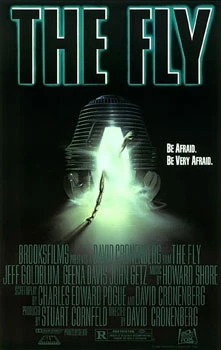 | The Fly | 1986 | Production Company | 90.3 | $40,460,948 | $35,680,423 |
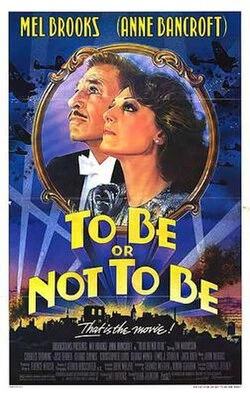 | To Be or Not to Be | 1983 | Production Company | 55.8 | $13,030,214 | $3,784,660 |
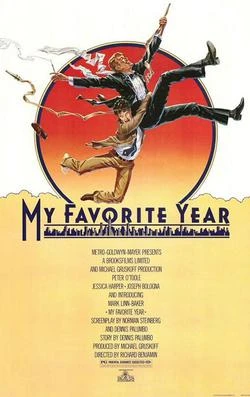 | My Favorite Year | 1982 | Production Company | 62.1 | $20,123,620 | $8,301,715 |
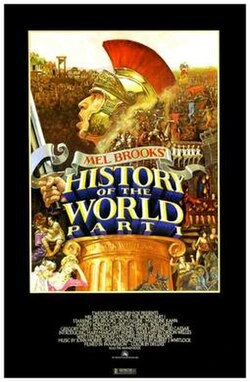 | History of the World: Part I | 1981 | Production Company | 77.2 | $31,672,908 | $16,442,681 |
Basic Facts
NameBrooksfilms Ltd.
TypeCompany
Role(s)
Production Company
Films in database14
Years in database1981-2020
Role counts
Production Company: 14
Movie Data
Average Movie Score62.8
Movie Score Min16.1
Movie Score Max90.3