Movie Box Office and Profits
Cumulative WW Box Office$666,688,973
Cumulative Profit$675,415,962
Cumulative Domestic Box Office$507,120,165
Average WW Box Office$22,989,275
Average Domestic Box Office$17,486,902
Average Profit / Loss Per Film$23,290,206
Filmography
| Poster | Movie | Year | Roles | Overall Score | Worldwide | Profit |
|---|---|---|---|---|---|---|
 | Highest 2 Lowest | 2025 | Production Company | 62.4 | $1,500,000 | $4,141,000 |
 | Jaws | 2022 | Production Company | 86.2 | $6,358,261 | $9,566,171 |
 | BlacKkKlansman | 2018 | Production Company | 93.3 | $93,400,824 | $29,582,699 |
 | Touched with Fire | 2016 | Production Company | 46.8 | $146,487 | $8,239,487 |
 | Chi-Raq | 2015 | Production Company | 59.6 | $2,719,699 | $-1,768,604 |
 | Oldboy | 2013 | Production Company | 68.4 | $5,186,767 | $-16,298,464 |
 | Red Hook Summer | 2012 | Production Company | 38.7 | $338,803 | $13,540,263 |
 | Miracle at St. Anna | 2008 | Production Company | 58.7 | $9,333,654 | $-24,806,039 |
 | Inside Man | 2006 | Production Company | 94.3 | $186,003,580 | $58,912,160 |
 | She Hate Me | 2004 | Production Company | 50.4 | $1,522,377 | $12,212,290 |
 | 25th Hour | 2002 | Production Company | 80.0 | $23,928,504 | $39,864,164 |
 | Bamboozled | 2000 | Production Company | 54.0 | $2,463,650 | $14,006,950 |
 | Love & Basketball | 2000 | Production Company | 77.6 | $27,728,118 | $29,108,113 |
 | The Original Kings of Comedy | 2000 | Production Company | 65.1 | $38,182,792 | $49,858,094 |
 | Summer of Sam | 1999 | Production Company | 69.4 | $19,288,130 | $21,239,216 |
 | The Best Man | 1999 | Production Company | 64.7 | $34,573,780 | $42,870,485 |
 | He Got Game | 1998 | Production Company | 72.2 | $21,567,852 | $20,549,889 |
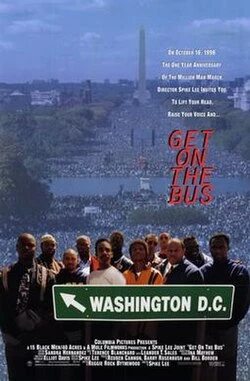 | Get on the Bus | 1996 | Production Company | 47.1 | $5,754,249 | $24,151,144 |
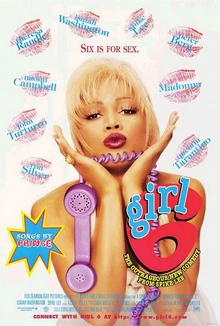 | Girl 6 | 1996 | Production Company | 39.4 | $4,939,939 | $12,806,945 |
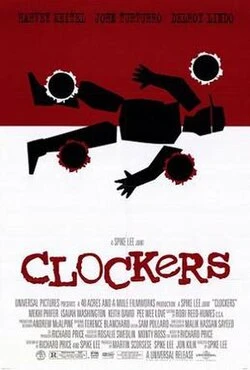 | Clockers | 1995 | Production Company | 58.9 | $13,071,518 | $17,142,923 |
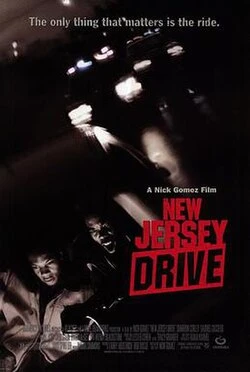 | New Jersey Drive | 1995 | Production Company | 36.7 | $3,565,508 | $15,380,957 |
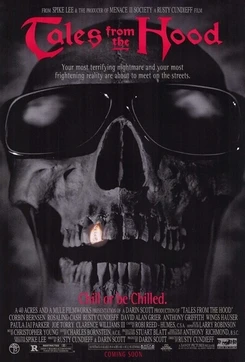 | Tales from the Hood | 1995 | Production Company | 53.6 | $11,837,928 | $34,706,067 |
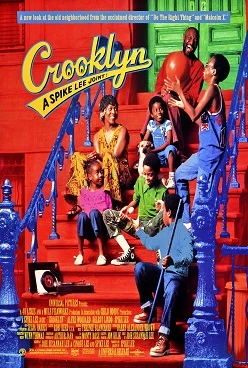 | Crooklyn | 1994 | Production Company | 56.7 | $13,642,861 | $30,337,717 |
 | Drop Squad | 1994 | Production Company | 15.6 | $734,693 | $6,803,224 |
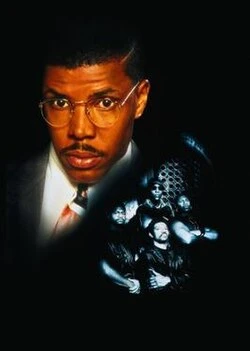
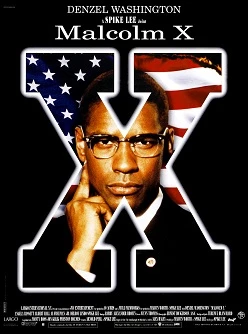 | Malcolm X | 1992 | Production Company | 86.5 | $48,169,912 | $57,758,434 |
 | Jungle Fever | 1991 | Production Company | 72.9 | $32,482,682 | $52,547,012 |
 | Mo' Better Blues | 1990 | Production Company | 61.4 | $16,153,593 | $32,760,659 |
 | Do the Right Thing | 1989 | Production Company | 85.2 | $27,546,968 | $53,291,083 |
 | School Daze | 1988 | Production Company | 60.5 | $14,545,844 | $26,911,925 |
Basic Facts

Name40 Acres and a Mule Filmworks
TypeCompany
Role(s)
Production Company
Films in database29
Years in database1988-2025
Role counts
Production Company: 29
Movie Data
Average Movie Score62.6
Movie Score Min15.6
Movie Score Max94.3