Synopsis
When the Davison family comes under attack during their wedding anniversary getaway, the gang of mysterious killers soon learns that one of the victims harbors a secret talent for fighting back.
Scores
Overall Score
79.0
Popularity Percentile (Year)
83.3%
Box Office Percentile (Year)
79.0%
Review Aggregate
69.1
Critic Consensus
Critic reception is largely positive, with 79% of 160 logged reviews marked Fresh. Across reviews, critics repeatedly emphasize funny, scary, dark. Most critics frame the film as an effective delivery of its core style and intent.
funnyscarydarkfamily-friendlygrittysuspensefulmacabrerealisticcharacter-drivenchristmas
Cast
| Cast | Year | Reported Salary | Inflation Adjusted | Notes |
|---|---|---|---|---|
| Sharni Vinson | 2013 | $48,000 | $65,000 | (est) |
| Nicholas Tucci | 2013 | $30,000 | $40,000 | (est) |
| Wendy Glenn | 2013 | $22,000 | $30,000 | (est) |
| A. J. Bowen | 2013 | $18,000 | $25,000 | (est) |
| Joe Swanberg | 2013 | $16,000 | $21,000 | (est) |
| Barbara Crampton | 2013 | $14,000 | $18,000 | (est) |
| Rob Moran | 2013 | $12,000 | $17,000 | (est) |
Aggregated Reviews
Rotten Tomatoes critic score79.0
RT critic review count160
Rotten Tomatoes audience score60.0
RT audience rating count25,000
IMDb rating6.6
IMDb votes116,631
Box Office ?
| Category | Year | Reported | Inflation Adjusted |
|---|---|---|---|
| Domestic | 2013 | $18,494,006 | $24,899,442 |
| International | 2013 | $8,401,475 | $11,311,343 |
| Worldwide | 2013 | $26,895,480 | $36,210,784 |
Earnings / Profitability
| Category | Year | Reported | Inflation Adjusted |
|---|---|---|---|
| Revenues | |||
| Theatrical Net Revenue | 2013 | $12,607,593 | $16,974,258 |
| Digital Rentals ? | 2013 | $4,263,000 | $5,739,499 |
| Digital Purchases ? | 2013 | $2,549,000 | $3,431,851 |
| Physical Rentals ? | 2013 | $5,510,000 | $7,418,400 |
| Physical Purchases ? | 2013 | $14,277,000 | $19,221,868 |
| TV & Streaming Revenue | 2013 | $4,438,561 | $5,975,866 |
| Total Revenues | 2013 | $43,645,154 | $58,761,742 |
| Expenses | |||
| Budget ? | 2013 | $1,000,000 | $1,346,352 |
| Print & Advertising (P&A) ? | 2013 | $1,250,000 (est) | $1,682,940 (est) |
| Participations | 2013 | $3,492,000 | $4,701,461 |
| Residuals ? | 2013 | $1,910,000 | $2,571,532 |
| Interest & Overhead | 2013 | $200,000 | $269,270 |
| Total Expenses | 2013 | $7,852,000 | $10,571,556 |
| Movie Net Profit or Loss | 2013 | $35,793,154 | $48,190,186 |
Similar Movies
| Poster | Movie | Year | Match | Overall | Est. Profit |
|---|---|---|---|---|---|
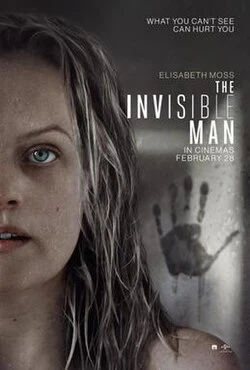 | The Invisible Man | 2020 | Shared genres: 4 | 95.0 | $95,007,588 |
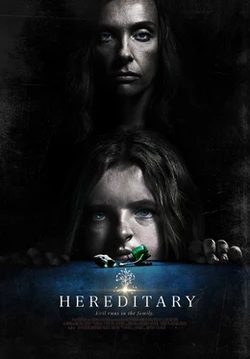 | Hereditary | 2018 | Shared genres: 4 | 91.9 | $35,074,687 |
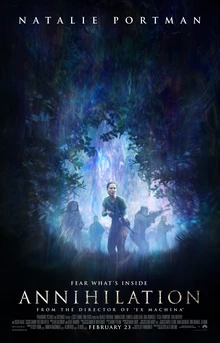 | Annihilation | 2018 | Shared genres: 4 | 89.5 | $-31,820,329 |
 | Midsommar | 2019 | Shared genres: 4 | 88.9 | $21,762,389 |
 | The Witch | 2016 | Shared genres: 4 | 87.5 | $32,194,737 |