Synopsis
Two upper-class teenage girls in suburban Connecticut rekindle their unlikely friendship after years of growing apart. Together, they hatch a plan to solve both of their problems-no matter what the cost.
Scores
Overall Score
74.7
Popularity Percentile (Year)
83.4%
Box Office Percentile (Year)
63.2%
Review Aggregate
75.1
Critic Consensus
Critic reception is largely positive, with 87% of 167 logged reviews marked Fresh. Across reviews, critics repeatedly emphasize dark, coming of age, funny. Most critics frame the film as an effective delivery of its core style and intent.
darkcoming of agefunnycharacter-drivennoirsatiricalstylizedpsychologicalvisually strikingsuspenseful
Cast
| Cast | Year | Reported Salary | Inflation Adjusted | Notes |
|---|---|---|---|---|
| Olivia Cooke | 2018 | $288,000 | $359,000 | (est) |
| Anya Taylor-Joy | 2018 | $177,000 | $221,000 | (est) |
| Anton Yelchin | 2018 | $133,000 | $166,000 | (est) |
| Paul Sparks | 2018 | $109,000 | $136,000 | (est) |
| Francie Swift | 2018 | $93,000 | $116,000 | (est) |
Aggregated Reviews
Rotten Tomatoes critic score87.0
RT critic review count167
Rotten Tomatoes audience score68.0
RT audience rating count2,500
IMDb rating6.6
IMDb votes48,126
Box Office ?
| Category | Year | Reported | Inflation Adjusted |
|---|---|---|---|
| Domestic | 2018 | $3,072,605 | $3,838,615 |
| International | 2018 | $114,650 | $143,233 |
| Worldwide | 2018 | $3,187,255 | $3,981,847 |
Earnings / Profitability
| Category | Year | Reported | Inflation Adjusted |
|---|---|---|---|
| Revenues | |||
| Theatrical Net Revenue | 2018 | $1,582,162 | $1,976,600 |
| Digital Rentals ? | 2018 | $3,180,000 | $3,972,784 |
| Digital Purchases ? | 2018 | $3,834,000 | $4,789,828 |
| Physical Rentals ? | 2018 | $1,959,000 | $2,447,385 |
| Physical Purchases ? | 2018 | $5,556,000 | $6,941,128 |
| TV & Streaming Revenue | 2018 | $1,229,042 | $1,535,446 |
| Total Revenues | 2018 | $17,340,204 | $21,663,171 |
| Expenses | |||
| Budget ? | 2018 | $5,000,000 | $6,246,515 |
| Print & Advertising (P&A) ? | 2018 | $3,028,000 (est) | $3,782,890 (est) |
| Participations | 2018 | $694,000 | $867,016 |
| Residuals ? | 2018 | $814,000 | $1,016,933 |
| Interest & Overhead | 2018 | $1,000,000 | $1,249,303 |
| Total Expenses | 2018 | $10,536,000 | $13,162,657 |
| Movie Net Profit or Loss | 2018 | $6,804,204 | $8,500,514 |
Similar Movies
| Poster | Movie | Year | Match | Overall | Est. Profit |
|---|---|---|---|---|---|
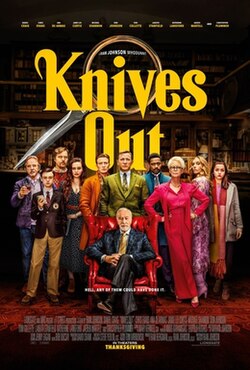 | Knives Out | 2019 | Shared genres: 4 | 96.6 | $77,594,197 |
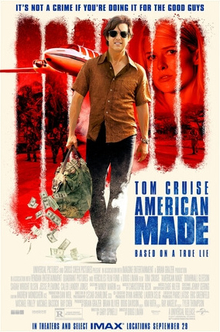 | American Made | 2017 | Shared genres: 4 | 89.7 | $-29,263,663 |
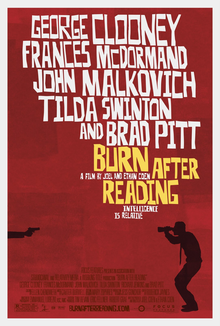 | Burn After Reading | 2008 | Shared genres: 4 | 89.4 | $40,618,932 |
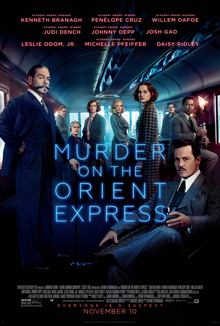 | Murder on the Orient Express | 2017 | Shared genres: 4 | 88.9 | $50,234,214 |
 | Glass Onion | 2022 | Shared genres: 4 | 88.3 | $-24,048,800 |