Synopsis
Their relationship on the rocks, a young Brooklyn couple heads to a remote B&B to work things out. But from the moment they arrive at The Happy House it's one disaster after another, and they soon begin to suspect they've wandered into a real life horror movie. Events escalate from weird to terrifying as they contend with the house's batty owner, her imposing son, a moody Swedish lepidopterist, a pedantic English professor, an extraordinarily rare butterfly, the world's best blueberry muffins, a .44 Magnum, a demented serial killer, and one very strict rulebook.
Scores
Popularity Percentile (Year)
90.1%
Box Office Percentile (Year)
1.9%
Critic Consensus
69.8% Fresh • 43 critic reviews
Critic reception is mixed, with 70% of 43 logged reviews marked Fresh. Across reviews, critics repeatedly emphasize funny, historical, scary. Common reservations focus on execution consistency, even when reviewers praise standout elements.
funnyhistoricalscarycharacter-drivenemotionalvisually striking
Aggregated Reviews
Rotten Tomatoes critic score65.0
RT critic review count60
Rotten Tomatoes audience score85.0
RT audience rating count250,000
IMDb rating4.4
IMDb votes510
Box Office ?
| Category | Year | Reported | Inflation Adjusted |
|---|
| Domestic | 2013 | $2,311 | $3,111 |
| International | 2013 | N/A | N/A |
| Worldwide | 2013 | $2,311 | $3,111 |
Earnings / Profitability
Estimated net revenues and net expenses for films based on reported and estimated numbers. This income statement should be considered most viable for the first 24 months after the inital movie's release (ie after most lucrative pay windows).
| Category | Year | Reported | Inflation Adjusted |
|---|
| Revenues |
| Theatrical Net Revenue | 2013 | $1,156 | $1,556 |
| Digital Rentals ? | 2013 | $69,000 | $92,898 |
| Digital Purchases ? | 2013 | $42,000 | $56,547 |
| Physical Rentals ? | 2013 | $90,000 | $121,172 |
| Physical Purchases ? | 2013 | $233,000 | $313,700 |
| TV & Streaming Revenue | 2013 | $3,600,000 | $4,846,867 |
| Total Revenues | 2013 | $4,035,156 | $5,432,740 |
| Expenses |
| Budget ? | 2013 | $12,000,000 | $16,156,224 |
| Print & Advertising (P&A) ? | 2013 | $80,000 (est) | $107,708 (est) |
| Participations | 2013 | $81,000 | $109,055 |
| Residuals ? | 2013 | $198,000 | $266,578 |
| Interest & Overhead | 2013 | $2,400,000 | $3,231,245 |
| Total Expenses | 2013 | $14,759,000 | $19,870,809 |
| Movie Net Profit or Loss | 2013 | $-10,723,844 | $-14,438,069 |
Similar Movies
| Poster | Movie | Year | Match | Overall | Est. Profit |
|---|
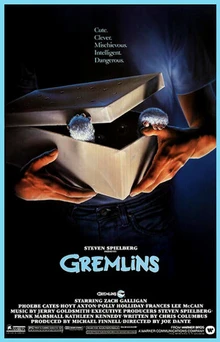 | Gremlins | 1984 | Shared genres: 3 | 93.6 | $106,400,153 |
 | Zombieland | 2009 | Shared genres: 3 | 92.3 | $47,905,435 |
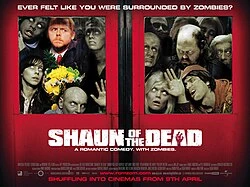 | Shaun of the Dead | 2004 | Shared genres: 3 | 89.7 | $44,643,639 |
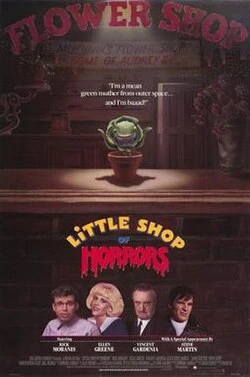 | Little Shop of Horrors | 1986 | Shared genres: 3 | 87.5 | $21,495,297 |
 | Goosebumps | 2015 | Shared genres: 3 | 86.4 | $-26,033,488 |
Tooltips
- Digital Rentals: PVOD, VOD, & On-Demand
- Marketing & distribution costs to release Movie in Theaters. Includes: Online & Offline Ads, Posters, Trailer Production, and physical or digital copies (formerly "prints") sent to cinemas.
- Net Digital Purchase Revenue
- Net Revenues for Physical Rentals: VHS, DVD, BluRay (when appropriate)
- Physical Purchases: VHS $0, DVD $167,000, BluRay $66,000
- Reported or Estimated Net Budget (after tax, product placements, & grants)
- Theatrical box office grosses split into Domestic, International, and Worldwide totals.
- Union-modeled residuals using SAG-AFTRA and WGA schedules as a simplified estimate proxy.
- reestimate_prior_estimate;covid_mult=1.00;peer_count=0;reg_box_pred=44436;reg_main_pred=187814
Budget Tooltip
Reported or Estimated Net Budget (after tax, product placements, & grants)
Comments
No approved comments yet.