Synopsis
A long abandoned slaughterhouse is transformed into modern lofts in a re-gentrified urban neighborhood. Soon after tenants move in they are tormented by a dark secret that has been trapped in the building for over 30 years.
Scores
Overall Score
21.5
Popularity Percentile (Year)
24.8%
Box Office Percentile (Year)
4.8%
Review Aggregate
43.2
Critic Consensus
Critic reception is largely negative, with 33% of 6 logged reviews marked Fresh. Across reviews, critics repeatedly emphasize family-friendly, scary, suspenseful. Many reviews cite execution consistency as the main reasons it falls short.
family-friendlyscarysuspensefulcharacter-drivenemotionalvisually striking
Cast
| Cast | Year | Reported Salary | Inflation Adjusted | Notes |
|---|---|---|---|---|
| Callum Blue | 2016 | $0 | $0 | (est) |
| Nadine Velazquez | 2016 | $0 | $0 | (est) |
| Makenzie Moss | 2016 | $0 | $0 | (est) |
| Erik LaRay Harvey | 2016 | $0 | $0 | (est) |
Aggregated Reviews
Rotten Tomatoes critic score33.0
RT critic review count6
Rotten Tomatoes audience score55.0
RT audience rating count100
IMDb rating4.3
IMDb votes1,429
Box Office ?
| Category | Year | Reported | Inflation Adjusted |
|---|---|---|---|
| Domestic | 2016 | $6,332 | $8,276 |
| International | 2016 | N/A | N/A |
| Worldwide | 2016 | $6,332 | $8,276 |
Earnings / Profitability
| Category | Year | Reported | Inflation Adjusted |
|---|---|---|---|
| Revenues | |||
| Theatrical Net Revenue | 2016 | $3,166 | $4,138 |
| Digital Rentals ? | 2016 | $127,000 | $166,000 |
| Digital Purchases ? | 2016 | $129,000 | $168,614 |
| Physical Rentals ? | 2016 | $111,000 | $145,086 |
| Physical Purchases ? | 2016 | $314,000 | $410,424 |
| TV & Streaming Revenue | 2016 | $75,000 | $98,031 |
| Total Revenues | 2016 | $759,166 | $992,293 |
| Expenses | |||
| Budget ? | 2016 | $250,000 (est) | $326,771 (est) |
| Print & Advertising (P&A) ? | 2016 | $80,000 (est) | $104,567 (est) |
| Participations | 2016 | $15,000 | $19,606 |
| Residuals ? | 2016 | $39,000 | $50,976 |
| Interest & Overhead | 2016 | $50,000 | $65,354 |
| Total Expenses | 2016 | $434,000 | $567,274 |
| Movie Net Profit or Loss | 2016 | $325,166 | $425,019 |
Similar Movies
| Poster | Movie | Year | Match | Overall | Est. Profit |
|---|---|---|---|---|---|
 | Get Out | 2017 | Shared genres: 3 | 95.6 | $149,931,644 |
 | The Invisible Man | 2020 | Shared genres: 3 | 95.0 | $95,007,588 |
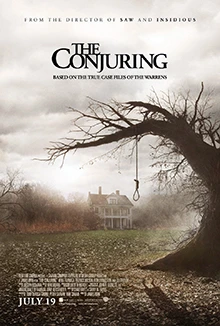 | The Conjuring | 2013 | Shared genres: 3 | 94.0 | $128,938,909 |
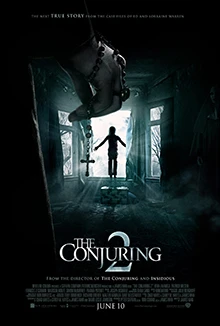 | The Conjuring 2 | 2016 | Shared genres: 3 | 93.2 | $75,554,508 |
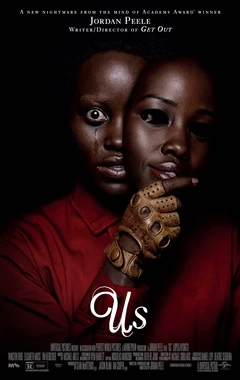 | Us | 2019 | Shared genres: 3 | 92.8 | $109,077,224 |