Synopsis
The story of the notorious 1970s New York City nightclub.
Scores
Overall Score
50.3
Popularity Percentile (Year)
45.9%
Box Office Percentile (Year)
39.4%
Review Aggregate
79.4
Critic Consensus
Critic reception is largely positive, with 90% of 83 logged reviews marked Fresh. Across reviews, critics repeatedly emphasize lighthearted, historical, emotional. Most critics frame the film as an effective delivery of its core style and intent.
lightheartedhistoricalemotionalgrittycharacter-drivenvisually striking
Cast
| Cast | Year | Reported Salary | Inflation Adjusted | Notes |
|---|---|---|---|---|
| Ian Schrager | 2018 | $5,000 | $7,000 | (est) |
| Steve Rubell | 2018 | $3,000 | $4,000 | (est) |
Aggregated Reviews
Rotten Tomatoes critic score90.0
RT critic review count83
Rotten Tomatoes audience score74.0
RT audience rating count250
IMDb rating7.0
IMDb votes3,794
Box Office ?
| Category | Year | Reported | Inflation Adjusted |
|---|---|---|---|
| Domestic | 2018 | $199,767 | $249,570 |
| International | 2018 | $40,010 | $49,985 |
| Worldwide | 2018 | $239,777 | $299,554 |
Earnings / Profitability
| Category | Year | Reported | Inflation Adjusted |
|---|---|---|---|
| Revenues | |||
| Theatrical Net Revenue | 2018 | $115,888 | $144,779 |
| Digital Rentals ? | 2018 | $1,607,000 | $2,007,630 |
| Digital Purchases ? | 2018 | $1,938,000 | $2,421,149 |
| Physical Rentals ? | 2018 | $990,000 | $1,236,810 |
| Physical Purchases ? | 2018 | $2,808,000 | $3,508,043 |
| TV & Streaming Revenue | 2018 | $99,884 | $124,785 |
| Total Revenues | 2018 | $7,558,771 | $9,443,196 |
| Expenses | |||
| Budget ? | 2018 | $231,000 (est) | $288,589 (est) |
| Print & Advertising (P&A) ? | 2018 | $168,000 (est) | $209,883 (est) |
| Participations | 2018 | $302,000 | $377,290 |
| Residuals ? | 2018 | $382,000 | $477,234 |
| Interest & Overhead | 2018 | $46,200 | $57,718 |
| Total Expenses | 2018 | $1,129,200 | $1,410,713 |
| Movie Net Profit or Loss | 2018 | $6,429,571 | $8,032,483 |
Similar Movies
| Poster | Movie | Year | Match | Overall | Est. Profit |
|---|---|---|---|---|---|
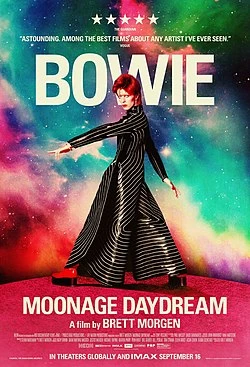 | Moonage Daydream | 2022 | Shared genres: 3 | 73.5 | $19,371,975 |
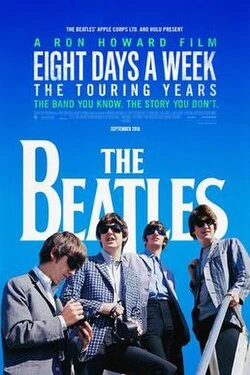 | The Beatles: Eight Days a Week - The Touring Years | 2016 | Shared genres: 3 | 71.7 | $11,826,727 |
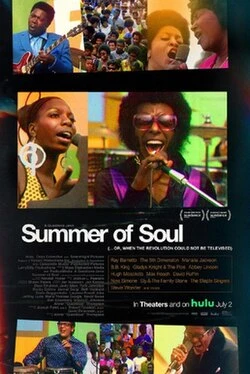 | Summer of Soul (...Or, When the Revolution Could Not Be Televised) | 2021 | Shared genres: 3 | 71.4 | $18,871,952 |
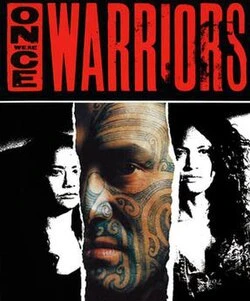 | Once Were Brothers | 2020 | Shared genres: 3 | 70.5 | $27,616,785 |
 | 20 Feet from Stardom | 2013 | Shared genres: 3 | 69.3 | $22,527,970 |