Synopsis
Four Mexican high school students form a robotics club. With no experience, 800 bucks, used car parts and a dream, this rag tag team goes up against the country's reigning robotics champion, MIT.
Scores
Overall Score
62.0
Popularity Percentile (Year)
59.2%
Box Office Percentile (Year)
61.1%
Review Aggregate
69.9
Critic Consensus
Critic reception is mixed, with 58% of 31 logged reviews marked Fresh. Across reviews, critics repeatedly emphasize uplifting, family-friendly, historical. Common reservations focus on execution consistency, even when reviewers praise standout elements.
upliftingfamily-friendlyhistoricalcharacter-drivenlightheartedcoming of age
Cast
| Cast | Year | Reported Salary | Inflation Adjusted | Notes |
|---|---|---|---|---|
| George Lopez | 2015 | $161,000 | $213,000 | (est) |
| Jamie Lee Curtis | 2015 | $99,000 | $131,000 | (est) |
| Carlos PenaVega | 2015 | $75,000 | $99,000 | (est) |
| Esai Morales | 2015 | $61,000 | $81,000 | (est) |
| José Julián | 2015 | $52,000 | $69,000 | (est) |
| David Del Rio | 2015 | $46,000 | $61,000 | (est) |
| Oscar Gutierrez | 2015 | $41,000 | $55,000 | (est) |
| Alexa PenaVega | 2015 | $38,000 | $50,000 | (est) |
| Alessandra Rosaldo | 2015 | $35,000 | $46,000 | (est) |
| Marisa Tomei | 2015 | $32,000 | $43,000 | (est) |
Aggregated Reviews
Rotten Tomatoes critic score58.0
RT critic review count31
Rotten Tomatoes audience score82.0
RT audience rating count5,000
IMDb rating7.2
IMDb votes12,270
Box Office ?
| Category | Year | Reported | Inflation Adjusted |
|---|---|---|---|
| Domestic | 2015 | $3,618,912 | $4,790,096 |
| International | 2015 | $82,413 | $109,084 |
| Worldwide | 2015 | $3,701,325 | $4,899,180 |
Earnings / Profitability
| Category | Year | Reported | Inflation Adjusted |
|---|---|---|---|
| Revenues | |||
| Theatrical Net Revenue | 2015 | $1,842,421 | $2,438,682 |
| Digital Rentals ? | 2015 | $2,982,000 | $3,947,061 |
| Digital Purchases ? | 2015 | $3,127,000 | $4,138,987 |
| Physical Rentals ? | 2015 | $3,383,000 | $4,477,836 |
| Physical Purchases ? | 2015 | $9,067,000 | $12,001,341 |
| TV & Streaming Revenue | 2015 | $1,447,565 | $1,916,038 |
| Total Revenues | 2015 | $21,848,986 | $28,919,945 |
| Expenses | |||
| Budget ? | 2015 | $4,000,000 | $5,294,515 |
| Print & Advertising (P&A) ? | 2015 | $3,516,000 (est) | $4,653,878 (est) |
| Participations | 2015 | $874,000 | $1,156,851 |
| Residuals ? | 2015 | $1,170,000 | $1,548,646 |
| Interest & Overhead | 2015 | $800,000 | $1,058,903 |
| Total Expenses | 2015 | $10,360,000 | $13,712,793 |
| Movie Net Profit or Loss | 2015 | $11,488,986 | $15,207,152 |
Similar Movies
| Poster | Movie | Year | Match | Overall | Est. Profit |
|---|---|---|---|---|---|
 | Schindler's List | 1993 | Shared genres: 3 | 97.8 | $98,679,299 |
 | Oppenheimer | 2023 | Shared genres: 3 | 97.7 | $236,293,513 |
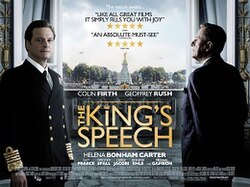 | The King's Speech | 2010 | Shared genres: 3 | 96.2 | $184,939,092 |
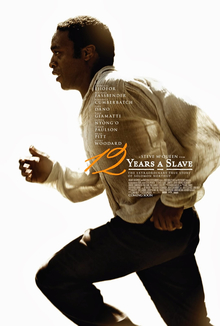 | 12 Years a Slave | 2013 | Shared genres: 3 | 94.9 | $64,511,478 |
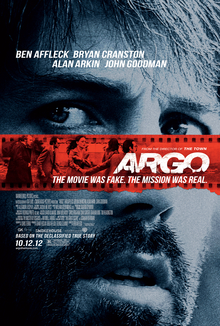 | Argo | 2012 | Shared genres: 3 | 94.9 | $60,917,892 |