Screen Profits
Most Profitable Movies
Most Profitable Movies
Box Office Bombs
Movies Decade
Genres
Franchises
Actor Net Worth Rankings
Back to movie
Pieces of April (2003) Similar Movies
20 similar titles
Similar Movies
Planes, Trains & Automobiles
Year
1987
Overall
90.4
Est. Profit
$46,239,710
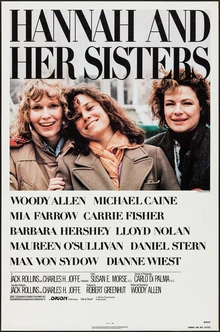
Hannah and Her Sisters
Year
1986
Overall
84.2
Est. Profit
$41,215,153
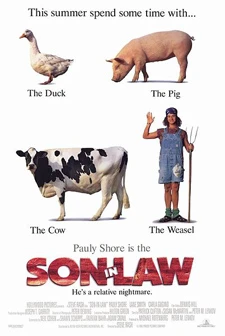
Son in Law
Year
1993
Overall
70.8
Est. Profit
$71,357,300
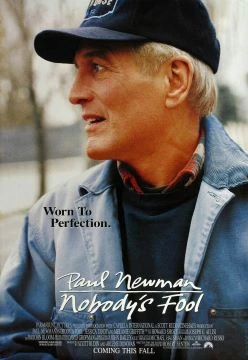
Nobody's Fool
Year
1994
Overall
70.0
Est. Profit
$65,357,982
Home for the Holidays
Year
1995
Overall
58.5
Est. Profit
$25,917,184
Dutch
Year
1991
Overall
51.5
Est. Profit
$6,058,907
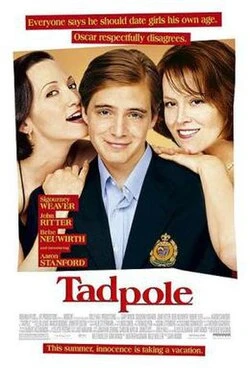
Tadpole
Year
2002
Overall
51.2
Est. Profit
$28,923,740
The House of Yes
Year
1997
Overall
43.3
Est. Profit
$13,619,451
What's Cooking?
Year
2000
Overall
42.1
Est. Profit
$17,205,812
The Myth of Fingerprints
Year
1997
Overall
30.2
Est. Profit
$10,191,722
Up
Year
2009
Overall
97.7
Est. Profit
$103,203,496
Inside Out
Year
2015
Overall
97.4
Est. Profit
$115,137,525
Knives Out
Year
2019
Overall
96.6
Est. Profit
$77,594,195
Dead Poets Society
Year
1989
Overall
96.5
Est. Profit
$108,454,614
The Truman Show
Year
1998
Overall
96.5
Est. Profit
$82,922,196
Inside Out 2
Year
2024
Overall
96.0
Est. Profit
$435,979,630
Big
Year
1988
Overall
95.9
Est. Profit
$84,885,694
La La Land
Year
2016
Overall
95.8
Est. Profit
$147,267,772
The Intouchables
Year
2012
Overall
95.5
Est. Profit
$143,746,007
Groundhog Day
Year
1993
Overall
95.4
Est. Profit
$78,676,441
 Planes, Trains & Automobiles