Synopsis
Filmed live on stage at the Pantages Theatre in Hollywood, California, this is a not-to-be-missed high-energy show starring the original Broadway cast members.
Scores
Overall Score
52.8
Popularity Percentile (Year)
47.1%
Box Office Percentile (Year)
40.7%
Review Aggregate
86.7
Critic Consensus
Critic reception is largely positive, with 100% of 1 logged reviews marked Fresh. Across reviews, critics repeatedly emphasize character-driven, emotional, visually striking. Most critics frame the film as an effective delivery of its core style and intent.
character-drivenemotionalvisually strikingthought-provokingrealistic
Cast
| Cast | Year | Reported Salary | Inflation Adjusted | Notes |
|---|---|---|---|---|
| N/A | ||||
Aggregated Reviews
Rotten Tomatoes critic scoreN/A
RT critic review count1
Rotten Tomatoes audience score90.0
RT audience rating count250
IMDb rating8.2
IMDb votes3,990
Box Office ?
| Category | Year | Reported | Inflation Adjusted |
|---|---|---|---|
| Domestic | 2018 | $282,429 | $352,839 |
| International | 2018 | N/A | N/A |
| Worldwide | 2018 | $282,429 | $352,839 |
Earnings / Profitability
| Category | Year | Reported | Inflation Adjusted |
|---|---|---|---|
| Revenues | |||
| Theatrical Net Revenue | 2018 | $141,214 | $176,420 |
| Digital Rentals ? | 2018 | $1,833,000 | $2,289,973 |
| Digital Purchases ? | 2018 | $2,210,000 | $2,760,960 |
| Physical Rentals ? | 2018 | $1,129,000 | $1,410,463 |
| Physical Purchases ? | 2018 | $3,203,000 | $4,001,518 |
| TV & Streaming Revenue | 2018 | $127,093 | $158,778 |
| Total Revenues | 2018 | $8,643,308 | $10,798,111 |
| Expenses | |||
| Budget ? | 2018 | $311,000 (est) | $388,533 (est) |
| Print & Advertising (P&A) ? | 2018 | $226,000 (est) | $282,342 (est) |
| Participations | 2018 | $346,000 | $432,259 |
| Residuals ? | 2018 | $437,000 | $545,945 |
| Interest & Overhead | 2018 | $62,200 | $77,707 |
| Total Expenses | 2018 | $1,382,200 | $1,726,787 |
| Movie Net Profit or Loss | 2018 | $7,261,108 | $9,071,324 |
Similar Movies
| Poster | Movie | Year | Match | Overall | Est. Profit |
|---|---|---|---|---|---|
 | Aladdin | 1992 | Shared genres: 1 | 97.7 | $232,328,117 |
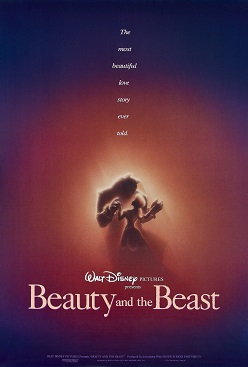 | Beauty and the Beast | 1991 | Shared genres: 1 | 97.5 | $142,339,086 |
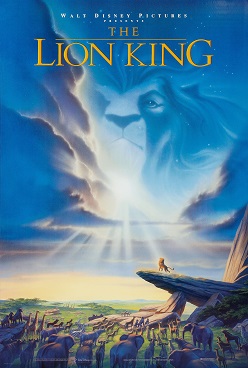 | The Lion King | 1994 | Shared genres: 1 | 97.1 | $363,040,227 |
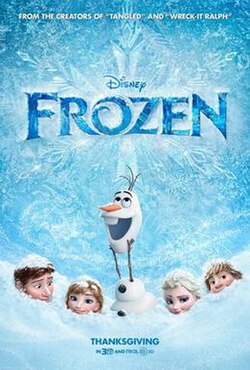 | Frozen | 2013 | Shared genres: 1 | 96.1 | $294,764,017 |
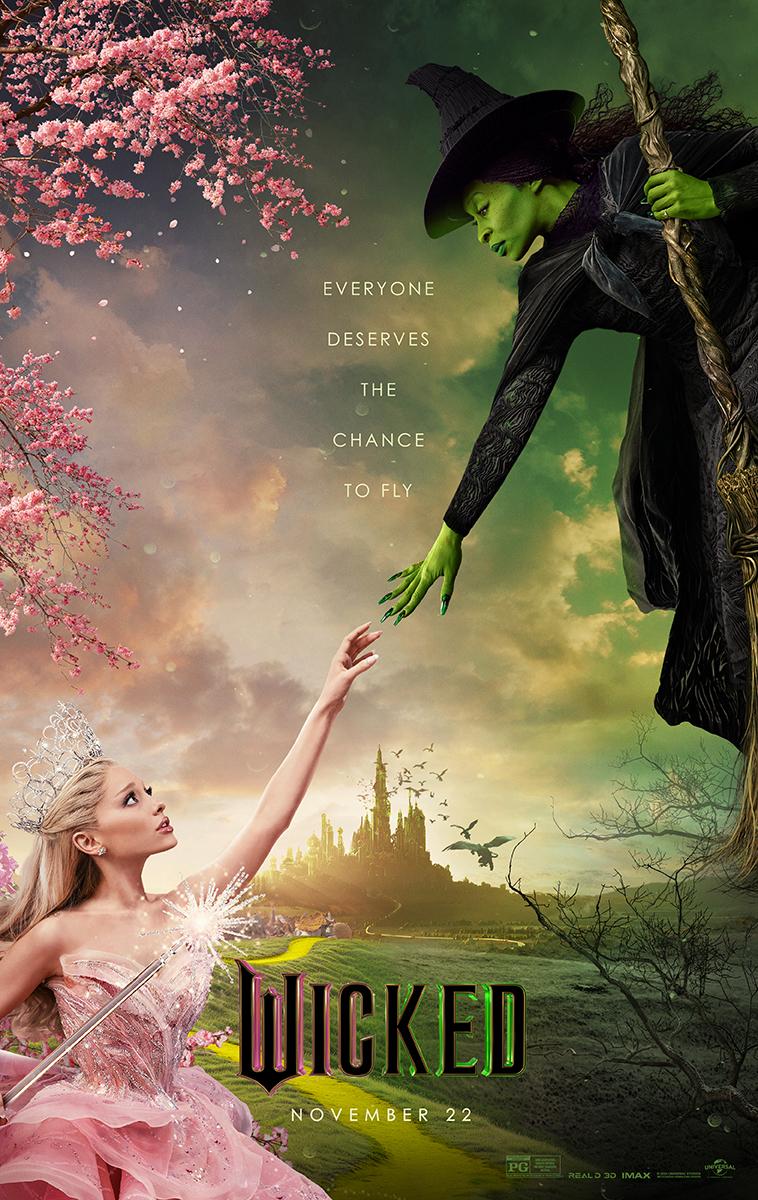 | Wicked | 2025 | Shared genres: 1 | 95.8 | $249,948,179 |