Synopsis
Wacky hijinks of counselors and campers at a less-than-average summer camp.
Scores
Overall Score
67.3
Popularity Percentile (Year)
64.5%
Box Office Percentile (Year)
72.4%
Review Aggregate
64.7
Critic Consensus
Critic reception is largely positive, with 79% of 28 logged reviews marked Fresh. Across reviews, critics repeatedly emphasize funny, stylized, character-driven. Most critics frame the film as an effective delivery of its core style and intent.
funnystylizedcharacter-drivenemotionalvisually strikingthought-provoking
Cast
| Cast | Year | Reported Salary | Inflation Adjusted | Notes |
|---|---|---|---|---|
| Bill Murray | 1979 | $240,000 source | $1,037,025 | reported |
| Harvey Atkin | 1979 | $47,000 | $205,000 | (est) |
| Kate Lynch | 1979 | $36,000 | $154,000 | (est) |
| Russ Banham | 1979 | $29,000 | $126,000 | (est) |
| Kristine DeBell | 1979 | $25,000 | $108,000 | (est) |
| Sarah Torgov | 1979 | $22,000 | $95,000 | (est) |
| Chris Makepeace | 1979 | $20,000 | $85,000 | (est) |
Aggregated Reviews
Rotten Tomatoes critic score73.0
RT critic review count37
Rotten Tomatoes audience score57.0
RT audience rating count25,000
IMDb rating6.2
IMDb votes25,416
Box Office ?
| Category | Year | Reported | Inflation Adjusted |
|---|---|---|---|
| Domestic | 1979 | $43,046,004 | $185,999,060 |
| International | 1979 | N/A | N/A |
| Worldwide | 1979 | $43,046,004 | $185,999,060 |
Earnings / Profitability
| Category | Year | Reported | Inflation Adjusted |
|---|---|---|---|
| Revenues | |||
| Theatrical Net Revenue | 1979 | $21,523,002 | $92,999,530 |
| Digital Rentals ? | 1979 | N/A | N/A |
| Digital Purchases ? | 1979 | N/A | N/A |
| Physical Rentals ? | 1979 | $2,057,000 | $8,888,167 |
| Physical Purchases ? | 1979 | $2,417,000 | $10,443,704 |
| TV & Streaming Revenue | 1979 | $12,052,881 | $52,079,737 |
| Total Revenues | 1979 | $38,049,883 | $164,411,138 |
| Expenses | |||
| Budget ? | 1979 | $1,600,000 | $6,913,499 |
| Print & Advertising (P&A) ? | 1979 | $2,000,000 (est) | $8,641,873 (est) |
| Participations | 1979 | $3,044,000 | $13,152,931 |
| Residuals ? | 1979 | $901,000 | $3,893,164 |
| Interest & Overhead | 1979 | $320,000 | $1,382,700 |
| Total Expenses | 1979 | $7,865,000 | $33,984,167 |
| Movie Net Profit or Loss | 1979 | $30,184,883 | $130,426,970 |
Similar Movies
| Poster | Movie | Year | Match | Overall | Est. Profit |
|---|---|---|---|---|---|
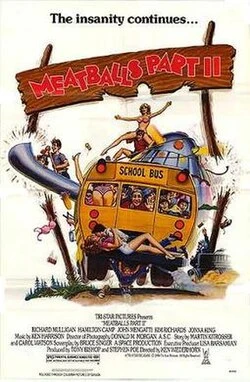 | Meatballs Part II | 1984 | Shared franchise (1) | 26.4 | $-631,281 |
 | Toy Story 3 | 2010 | Shared genres: 1 | 98.0 | $216,158,051 |
 | Toy Story | 1995 | Shared genres: 1 | 97.9 | $171,576,210 |
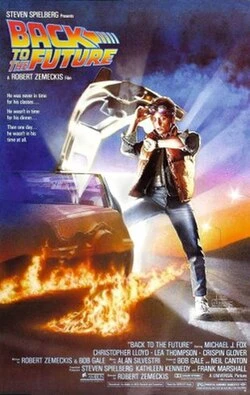 | Back to the Future | 1985 | Shared genres: 1 | 97.9 | $140,846,675 |
 | Aladdin | 1992 | Shared genres: 1 | 97.7 | $232,328,119 |