Synopsis
A troubled security guard begins working at Freddy Fazbear's Pizza. During his five nights on the job, he realizes that something is wrong with the pizzeria and pretty soon finds the truth about its animatronics.
Scores
Overall Score
85.0
Popularity Percentile (Year)
89.4%
Box Office Percentile (Year)
95.5%
Review Aggregate
56.8
Critic Consensus
Critic reception is mixed, with 42% of 50 logged reviews marked Fresh. Across reviews, critics repeatedly emphasize thin plot, scary, family-friendly. Common reservations focus on thin plot, even when reviewers praise standout elements.
thin plotscaryfamily-friendlymacabrepsychologicalfunnycoming of agestylizedvisually strikingdark
Cast
| Cast | Year | Reported Salary | Inflation Adjusted | Notes |
|---|---|---|---|---|
| Josh Hutcherson | 2023 | $750,000 source | $772,153 | reported |
| Elizabeth Lail | 2023 | $885,000 | $911,000 | (est) |
| Piper Rubio | 2023 | $666,000 | $686,000 | (est) |
| Mary Stuart Masterson | 2023 | $545,000 | $561,000 | (est) |
| Matthew Lillard | 2023 | $466,000 | $480,000 | (est) |
Aggregated Reviews
Rotten Tomatoes critic score33.0
RT critic review count215
Rotten Tomatoes audience score86.0
RT audience rating count2,500
IMDb rating5.4
IMDb votes119,743
Box Office ?
| Category | Year | Reported | Inflation Adjusted |
|---|---|---|---|
| Domestic | 2023 | $137,275,620 | $141,330,364 |
| International | 2023 | $154,218,000 | $158,773,176 |
| Worldwide | 2023 | $291,493,620 | $300,103,540 |
Earnings / Profitability
| Category | Year | Reported | Inflation Adjusted |
|---|---|---|---|
| Revenues | |||
| Theatrical Net Revenue | 2023 | $130,325,010 | $134,174,452 |
| Digital Rentals ? | 2023 | $5,816,000 | $5,987,789 |
| Digital Purchases ? | 2023 | $8,943,000 | $9,207,152 |
| Physical Rentals ? | 2023 | $1,281,000 | $1,318,837 |
| Physical Purchases ? | 2023 | $3,832,000 | $3,945,187 |
| TV & Streaming Revenue | 2023 | $34,318,905 | $35,332,591 |
| Total Revenues | 2023 | $184,515,915 | $189,966,008 |
| Expenses | |||
| Budget ? | 2023 | $20,000,000 | $20,590,745 |
| Print & Advertising (P&A) ? source | 2023 | $60,000,000 | $61,772,235 |
| Participations | 2023 | $14,761,000 | $15,196,999 |
| Residuals ? | 2023 | $2,425,000 | $2,496,628 |
| Interest & Overhead | 2023 | $4,000,000 | $4,118,149 |
| Total Expenses | 2023 | $101,186,000 | $104,174,756 |
| Movie Net Profit or Loss | 2023 | $83,329,915 | $85,791,252 |
Similar Movies
| Poster | Movie | Year | Match | Overall | Est. Profit |
|---|---|---|---|---|---|
 | Get Out | 2017 | Shared genres: 3 | 95.6 | $149,931,640 |
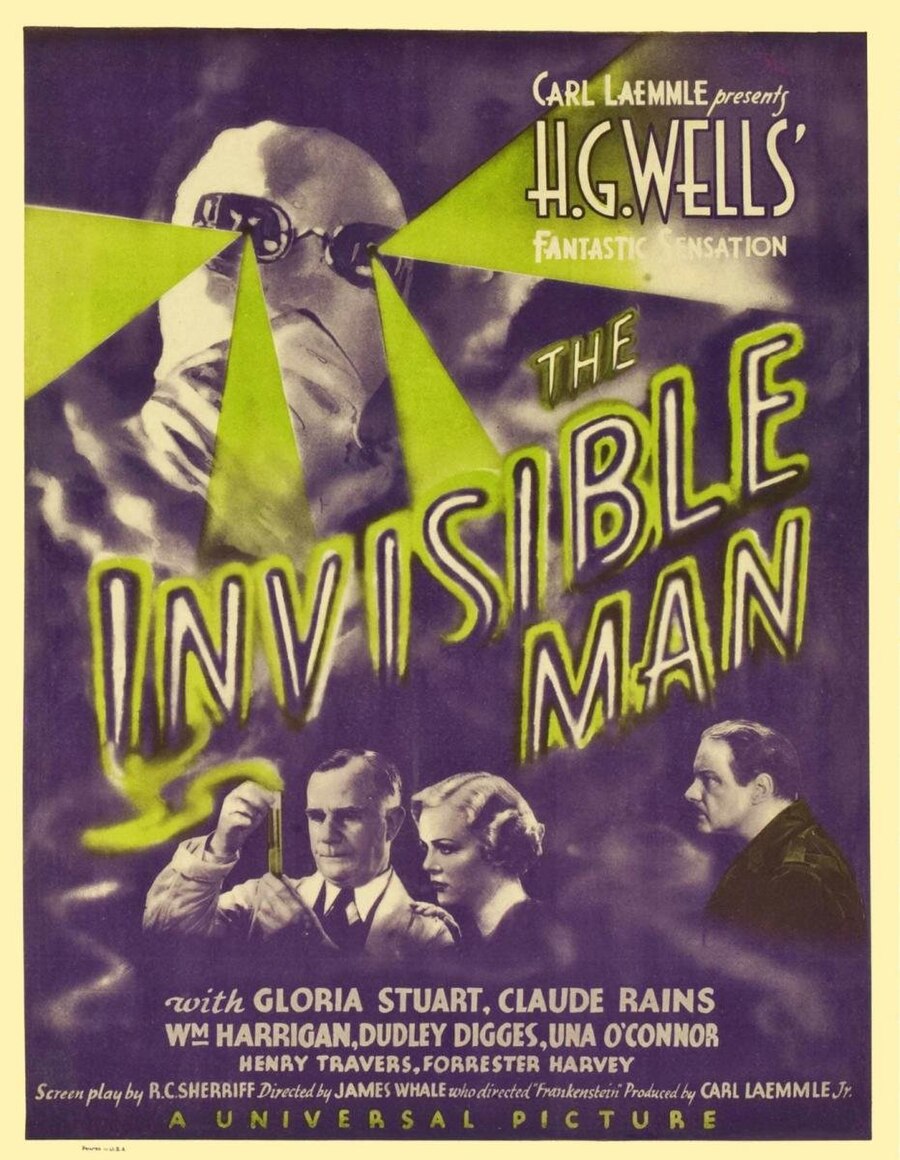 | The Invisible Man | 2020 | Shared genres: 3 | 95.0 | $95,007,590 |
 | The Conjuring | 2013 | Shared genres: 3 | 94.0 | $128,938,909 |
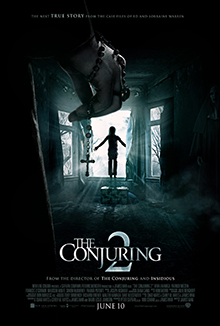 | The Conjuring 2 | 2016 | Shared genres: 3 | 93.2 | $75,554,506 |
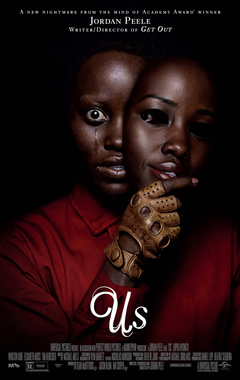 | Us | 2019 | Shared genres: 3 | 92.8 | $109,077,223 |