Synopsis
The History of American Punk Rock 1980-1986
Scores
Overall Score
54.5
Popularity Percentile (Year)
55.7%
Box Office Percentile (Year)
41.6%
Review Aggregate
74.3
Critic Consensus
Critic reception is mixed, with 71% of 58 logged reviews marked Fresh. Across reviews, critics repeatedly emphasize thin plot, family-friendly, historical. Common reservations focus on thin plot, even when reviewers praise standout elements.
thin plotfamily-friendlyhistoricalgrittystylizedrealisticdarkemotionalscary
Cast
| Cast | Year | Reported Salary | Inflation Adjusted | Notes |
|---|---|---|---|---|
| Bad Brains | 2006 | $5,000 | $7,000 | (est) |
| Black Flag | 2006 | $3,000 | $5,000 | (est) |
| Circle Jerks | 2006 | $2,000 | $3,000 | (est) |
| D.O.A. | 2006 | $2,000 | $3,000 | (est) |
| Minor Threat | 2006 | $2,000 | $2,000 | (est) |
Aggregated Reviews
Rotten Tomatoes critic score72.0
RT critic review count60
Rotten Tomatoes audience score78.0
RT audience rating count25,000
IMDb rating7.3
IMDb votes3,693
Box Office ?
| Category | Year | Reported | Inflation Adjusted |
|---|---|---|---|
| Domestic | 2006 | $279,665 | $435,173 |
| International | 2006 | $96,392 | $149,991 |
| Worldwide | 2006 | $376,057 | $585,164 |
Earnings / Profitability
| Category | Year | Reported | Inflation Adjusted |
|---|---|---|---|
| Revenues | |||
| Theatrical Net Revenue | 2006 | $178,389 | $277,583 |
| Digital Rentals ? | 2006 | $222,000 | $345,443 |
| Digital Purchases ? | 2006 | $68,000 | $105,812 |
| Physical Rentals ? | 2006 | $7,012,000 | $10,911,033 |
| Physical Purchases ? | 2006 | $16,539,000 | $25,735,536 |
| TV & Streaming Revenue | 2006 | $125,849 | $195,828 |
| Total Revenues | 2006 | $24,145,239 | $37,571,235 |
| Expenses | |||
| Budget ? | 2006 | $414,000 (est) | $644,205 (est) |
| Print & Advertising (P&A) ? | 2006 | $263,000 (est) | $409,242 (est) |
| Participations | 2006 | $966,000 | $1,503,146 |
| Residuals ? | 2006 | $1,751,000 | $2,724,646 |
| Interest & Overhead | 2006 | $82,800 | $128,841 |
| Total Expenses | 2006 | $3,476,800 | $5,410,080 |
| Movie Net Profit or Loss | 2006 | $20,668,439 | $32,161,155 |
Similar Movies
| Poster | Movie | Year | Match | Overall | Est. Profit |
|---|---|---|---|---|---|
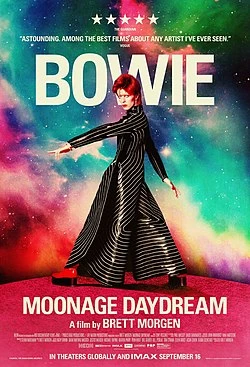 | Moonage Daydream | 2022 | Shared genres: 3 | 73.5 | $19,371,975 |
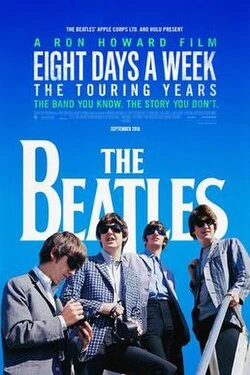 | The Beatles: Eight Days a Week - The Touring Years | 2016 | Shared genres: 3 | 71.7 | $11,826,727 |
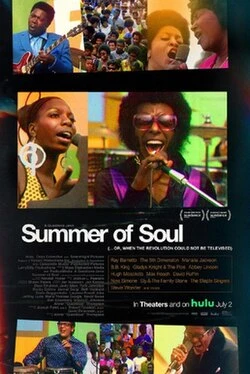 | Summer of Soul (...Or, When the Revolution Could Not Be Televised) | 2021 | Shared genres: 3 | 71.4 | $18,871,952 |
 | Once Were Brothers | 2020 | Shared genres: 3 | 70.5 | $27,616,785 |
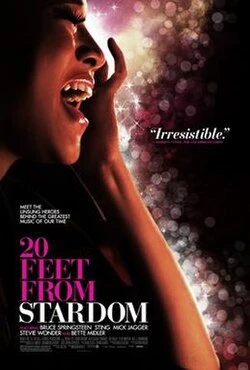 | 20 Feet from Stardom | 2013 | Shared genres: 3 | 69.3 | $22,527,970 |