Synopsis
Alive and Kicking gives the audience an intimate, insider's view into the culture of the current swing dance world while shedding light on issues facing modern society.
Scores
Overall Score
36.4
Popularity Percentile (Year)
16.9%
Box Office Percentile (Year)
30.3%
Review Aggregate
90.9
Critic Consensus
Critic reception is largely positive, with 100% of 11 logged reviews marked Fresh. Across reviews, critics repeatedly emphasize dark, character-driven, emotional. Most critics frame the film as an effective delivery of its core style and intent.
darkcharacter-drivenemotionalvisually strikinghistoricalthought-provoking
Cast
| Cast | Year | Reported Salary | Inflation Adjusted | Notes |
|---|---|---|---|---|
| Sybil Thorndike | 2017 | $1,000 | $1,000 | (est) |
| Kathleen Harrison | 2017 | $1,000 | $1,000 | (est) |
| Estelle Winwood | 2017 | $0 | $1,000 | (est) |
| Stanley Holloway | 2017 | $0 | $0 | (est) |
Aggregated Reviews
Rotten Tomatoes critic score100.0
RT critic review count11
Rotten Tomatoes audience score94.0
RT audience rating count100
IMDb rating7.2
IMDb votes525
Box Office ?
| Category | Year | Reported | Inflation Adjusted |
|---|---|---|---|
| Domestic | 2017 | $68,485 | $87,653 |
| International | 2017 | N/A | N/A |
| Worldwide | 2017 | $68,485 | $87,653 |
Earnings / Profitability
| Category | Year | Reported | Inflation Adjusted |
|---|---|---|---|
| Revenues | |||
| Theatrical Net Revenue | 2017 | $34,242 | $43,826 |
| Digital Rentals ? | 2017 | $1,162,000 | $1,487,227 |
| Digital Purchases ? | 2017 | $1,297,000 | $1,660,012 |
| Physical Rentals ? | 2017 | $867,000 | $1,109,661 |
| Physical Purchases ? | 2017 | $2,490,000 | $3,186,916 |
| TV & Streaming Revenue | 2017 | $75,000 | $95,991 |
| Total Revenues | 2017 | $5,925,242 | $7,583,634 |
| Expenses | |||
| Budget ? | 2017 | $250,000 (est) | $319,971 (est) |
| Print & Advertising (P&A) ? | 2017 | $80,000 (est) | $102,391 (est) |
| Participations | 2017 | $237,000 | $303,333 |
| Residuals ? | 2017 | $317,000 | $405,724 |
| Interest & Overhead | 2017 | $50,000 | $63,994 |
| Total Expenses | 2017 | $934,000 | $1,195,413 |
| Movie Net Profit or Loss | 2017 | $4,991,242 | $6,388,220 |
Similar Movies
| Poster | Movie | Year | Match | Overall | Est. Profit |
|---|---|---|---|---|---|
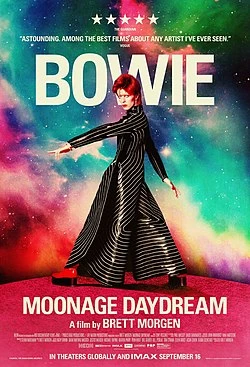 | Moonage Daydream | 2022 | Shared genres: 3 | 73.5 | $19,371,975 |
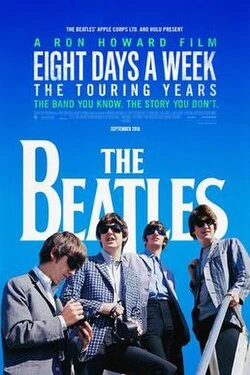 | The Beatles: Eight Days a Week - The Touring Years | 2016 | Shared genres: 3 | 71.7 | $11,826,727 |
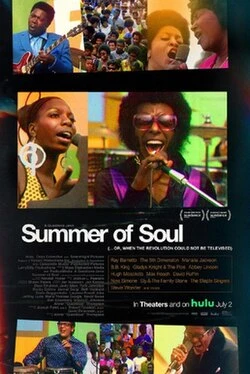 | Summer of Soul (...Or, When the Revolution Could Not Be Televised) | 2021 | Shared genres: 3 | 71.4 | $18,871,952 |
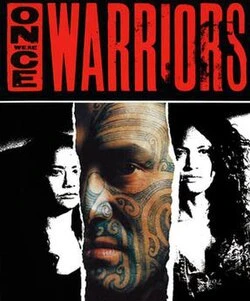 | Once Were Brothers | 2020 | Shared genres: 3 | 70.5 | $27,616,785 |
 | 20 Feet from Stardom | 2013 | Shared genres: 3 | 69.3 | $22,527,970 |